A full lab report usually has seven parts, in this order: a title page, an abstract, an introduction that ends on a hypothesis, materials and methods, results with tables and figures, a discussion, and references. Below is a complete short lab report example on temperature and the enzyme catalase, annotated section by section, followed by the tense and length of each section and the mistakes writing-center guides warn about.
Key Takeaways
- The four core sections answer four questions: what was the problem, how did you test it, what did you find, and what does it mean.
- Past tense for what you did and found, present tense for established knowledge. Where guides disagree, your instructor wins.
- Show each data set once, in a table or a figure, and describe the trend in words without repeating the numbers.
- Open the discussion by saying whether the data supported the hypothesis (“supported”, never “proved”).
- Hamilton College’s biology handout sets two to five double-spaced pages of text, not counting tables, figures and references.
What does a typical lab report look like?
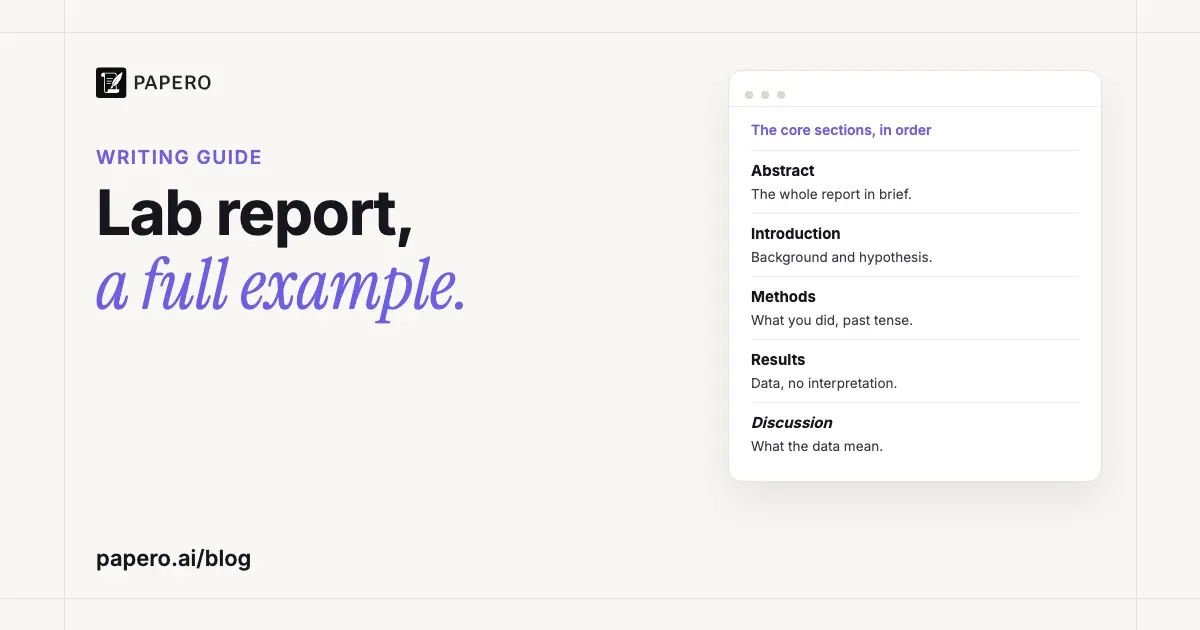
A typical lab report runs from a title page through an abstract, introduction, materials and methods, results, discussion and references, and each section answers one question, most of them in a set tense. The questions for the four core sections come from Hamilton College’s biology handout, which maps the core sections onto the steps of an experiment; the tenses come from the University of Washington’s Psychology Writing Center.
| Section | Question it answers | Main tense | Typical length |
|---|---|---|---|
| Title page | What is the report about, and who did the work? | None | Title, your name, course, date and lab partners |
| Abstract | What was done, found and concluded? | Past for what you did and found, present for what it means | One paragraph of 5 to 8 sentences (Reed) |
| Introduction | What is the problem? | Present for established knowledge, past for earlier studies, future for the hypothesis | One to three paragraphs (Hamilton) |
| Materials and methods | How did I solve the problem? | Past | Short, but enough detail to repeat the experiment |
| Results | What did I find out? | Past | Often the shortest section (UNC) |
| Discussion | What does it mean? | Past for your results, present for what they mean | Several paragraphs, from specific to general |
| References | Whose work did I use? | None | Every source cited in the text, and only those |
Hamilton treats acknowledgments and appendices as optional extras, and the UNC Writing Center notes that some courses call the discussion “Conclusions” or ask for a separate hypothesis section.
Lab report example: temperature and catalase activity
The report below was written for this guide as a model for an introductory biology lab. The data are invented for teaching: the numbers are internally consistent but were never measured. The background sources are real and appear in the report’s reference list. A short note after each section explains why it is written that way.
Sample lab report (data invented for teaching; cited sources are real).
Title page
Effect of Temperature on Catalase Activity in Potato Extract
[Your name]
Biology 101, Lab Section 3
Lab partners: [names]
Submitted [date]
Why it works. The title names the independent variable (temperature), the dependent variable (catalase activity) and the material, so the reader knows the study from one line. The items are the ones Hamilton’s handout lists: title, name, date, course and lab partners. If you are not sure which variable is which in your own experiment, the guide to independent and dependent variables has a one-sentence test.
Abstract
Abstract
Catalase breaks down hydrogen peroxide into water and oxygen, and like other enzymes its activity depends on temperature. We measured how temperature affected catalase activity in a crude potato extract, and whether activity lost at a low or high temperature returned when the extract was brought back to 37 °C. Extract was mixed with 3% hydrogen peroxide and a detergent that traps the oxygen as foam, and foam height after 2 min was recorded as a measure of activity (n = 5 tubes per condition). Foam height rose from 13.0 mm at 4 °C to 46.8 mm at 37 °C, then fell to 28.8 mm at 55 °C and 4.4 mm at 70 °C. Extract chilled to 4 °C regained almost all of its activity at 37 °C, but extract heated to 70 °C did not. These results suggest that cold slows catalase reversibly, while heating to 70 °C damages it permanently, as heat denaturation would predict.
Why it works. Six sentences in the order Reed’s instructions give: context, what was done, how, what was found, what it means. Past tense for the experiment, present for the general fact and the conclusion. Reed asks for results “in qualitative terms” here, while many instructors want the key numbers, so check your handout. Our abstract example guide applies the same order to research papers.
Introduction
Introduction
Enzymes are biological catalysts. Almost all are proteins, and they speed up reactions by lowering the activation energy the reaction needs (Clark et al., 2018). Higher temperatures generally increase reaction rates, but temperatures outside an enzyme’s optimal range can change the bonds in its active site so that it binds its substrate less well, and high temperatures eventually denature it (Clark et al., 2018). Denaturation changes a protein’s shape without changing its amino acid sequence; it is often reversible once the cause is removed, but sometimes the protein loses its function for good (Clark et al., 2018).
Catalase breaks down hydrogen peroxide into water and oxygen (Iwase et al., 2013). Iwase et al. (2013) showed that when the detergent Triton X-100 is added, the oxygen is trapped as foam whose height increases in a straight line with the amount of catalase in the sample. Potato tubers contain catalase: Spychalla and Desborough (1990) measured it in four cultivars and found that its level rose during 40 weeks of storage. Potato extract is therefore a cheap source of the enzyme.
The purpose of this experiment was to find out how temperature affects catalase activity in potato extract, and whether the effect can be reversed. We hypothesized that foam height would increase from 4 °C to an intermediate temperature and decrease at 55 °C and 70 °C. We also hypothesized that activity lost at 70 °C would not return on cooling, because denaturation by strong heat can be permanent, whereas activity lowered at 4 °C would return on warming, because lower temperatures slow reactions in general (Clark et al., 2018).
Why it works. It moves from broad to narrow, as Hamilton’s handout asks: enzymes, then catalase, then this experiment. Every background claim is cited, and the section ends on the purpose and two hypotheses, each with its reason, which UNC’s handout calls “motivating” the hypothesis. Each names its independent and dependent variable, the test our hypothesis examples apply, and the glossary entry on the hypothesis statement defines each part. The hypotheses are reported in the past tense, “We hypothesized that … would”, because the report is written after the experiment; UW’s future tense fits a hypothesis stated as a prediction, as in a proposal.
Materials and methods
Materials and Methods
We blended 25 g of peeled potato with 50 mL of cold distilled water, filtered the mixture through cheesecloth, and kept the extract on ice for no more than 1 h. Each trial used a 16 × 150 mm test tube containing 1 mL of extract. The method was adapted from Iwase et al. (2013), who used 100 µL each of sample, 1% Triton X-100 and 30% hydrogen peroxide and read the foam after the reaction had finished; we used 1 mL of each, 3% hydrogen peroxide for safety, and a fixed 2-min reading.
Effect of temperature. Tubes of extract and of 3% hydrogen peroxide were held for 5 min in a refrigerated water bath (4 °C) or in water baths at 20, 37, 55 or 70 °C. We then added 1 mL of 1% Triton X-100 and 1 mL of hydrogen peroxide at the same temperature to each tube of extract, swirled it, returned it to its bath, and measured the foam height with a ruler after 2 min. Five tubes were tested at each temperature.
Reversibility. Extract was held for 10 min at 4 °C or 70 °C, then for 5 min at 37 °C, and tested at 37 °C. Extract held for 15 min at 37 °C was the comparison group, so all three groups spent the same time out of the ice. Five tubes were tested per group.
Controls. As a control for breakdown of hydrogen peroxide without the enzyme, five tubes received distilled water in place of extract; as a control for enzyme activity, five received extract boiled for 10 min. Both were tested at 37 °C. We report the mean and standard deviation (SD) of foam height for each condition.
Why it works. It is a past-tense narrative, not the “recipe” of commands UNC’s handout warns against. Every quantity has a unit, as Reed asks, and the departure from the source method is stated, as Hamilton asks for any change to the lab directions. Each control group is named with what it controls for, UNC’s two-part rule. No results appear yet; the glossary entry on the methodology section covers how much detail is enough. A research paper’s methods also state the design, the sample size and the analysis plan, which our guide on how to write a methodology section works through with two published examples.
Results
Results
Foam height depended strongly on temperature (Figure 1). It increased from 4 °C to its highest value of the five temperatures tested, at 37 °C, and fell at 55 °C. At 70 °C, mean foam height was less than a tenth of that at 37 °C. Variation among tubes was greatest at 55 °C. Neither control produced more than 1 mm of foam in any tube.
Extract chilled to 4 °C and then warmed to 37 °C produced almost as much foam as the comparison group, whereas extract heated to 70 °C and then cooled produced very little (Table 1).
[Figure 1, described here: a line graph with temperature (°C) on the x-axis and mean foam height (mm) on the y-axis. The five plotted points, with error bars of ±1 SD, are 4 °C, 13.0 ± 1.6 mm; 20 °C, 30.2 ± 1.9 mm; 37 °C, 46.8 ± 1.9 mm; 55 °C, 28.8 ± 3.0 mm; and 70 °C, 4.4 ± 1.1 mm.]
Figure 1. Mean height of oxygen foam produced by potato extract 2 min after adding 3% hydrogen peroxide at five temperatures. Extract and hydrogen peroxide were held at the test temperature for 5 min before mixing. Error bars show ±1 SD; n = 5 tubes per temperature.
Table 1. Catalase Activity of Potato Extract After Holding at Three Temperaturesa
Holding temperature (°C) Mean foam height (mm) SD (mm) n 4 45.6 1.1 5 37 (comparison) 46.4 1.1 5 70 3.8 0.8 5 a Extract was held for 10 min at 4 °C or 70 °C, then for 5 min at 37 °C; the comparison group was held for 15 min at 37 °C. Foam height was measured 2 min after adding 3% hydrogen peroxide, with every tube at 37 °C.
Why it works. The text states each trend and points to its figure or table without repeating the plotted numbers, as UNC’s handout asks; Hamilton calls a missing narrative of this kind one of beginners’ most common omissions. The temperature series is a trend, so it is a graph, as Reed prefers; the reversibility test is a small table, and no data appear twice. Following Reed, the legend sits below the figure and the caption above the table. For APA layout, see our APA table format guide; the glossary entry on the results section sums up what belongs here.
Discussion
Discussion
The results supported both hypotheses. Catalase activity, measured as foam height, rose with temperature up to 37 °C and fell above it, and the loss at 70 °C did not reverse on cooling. Activity at 4 °C was just over a quarter of that at 37 °C (13.0 mm vs 46.8 mm), yet extract that had spent 10 min at 4 °C recovered 98% of the comparison group’s activity once warmed, so cold slowed the reaction without damaging the enzyme. Extract heated to 70 °C kept only about 8% of the comparison group’s activity after cooling, which fits irreversible denaturation (Clark et al., 2018).
Two features of the design limit these conclusions. With only five temperatures, the data show that activity was highest at 37 °C among those tested, not that 37 °C is the optimum; the peak could lie anywhere between 20 °C and 55 °C. And in the temperature series the foam formed at different temperatures, and we did not test whether Triton X-100 foam is equally stable at 4 °C and 70 °C. The reversibility test avoids this problem because every tube was measured at 37 °C, which makes it the stronger evidence that heat, not foam behavior, caused the loss.
Foam height is a relative measure here: Iwase et al. (2013) calibrated it with 30% hydrogen peroxide and an end-point reading, and we did not calibrate our version, so our values compare conditions within this experiment but cannot be converted into enzyme units. Comparisons between lab groups need the same caution, because catalase levels in potatoes change during storage (Spychalla & Desborough, 1990). A follow-up should test 20 °C to 55 °C in 5 °C steps to locate the peak.
Why it works. The first sentence answers the hypotheses, the opening UNC recommends, and says “supported”, not “proved”. The rest covers the other items on UNC’s list: what the data show, the design’s limits and earlier work. Each limitation is specific and says how it could affect the result, UNC’s test for a weakness worth naming. There is no “success” or “failure” verdict and no “I learned a lot”, both of which Hamilton’s handout rules out.
References
References
Clark, M. A., Douglas, M., & Choi, J. (2018). Biology 2e. OpenStax. https://openstax.org/books/biology-2e/pages/1-introduction
Iwase, T., Tajima, A., Sugimoto, S., Okuda, K., Hironaka, I., Kamata, Y., Takada, K., & Mizunoe, Y. (2013). A simple assay for measuring catalase activity: A visual approach. Scientific Reports, 3, Article 3081. https://doi.org/10.1038/srep03081
Spychalla, J. P., & Desborough, S. L. (1990). Superoxide dismutase, catalase, and α-tocopherol content of stored potato tubers. Plant Physiology, 94(3), 1214–1218. https://doi.org/10.1104/pp.94.3.1214
Why it works. Every source is cited in the text and every citation is listed, the two-way match Reed’s instructions require. The list is in APA 7; Hamilton’s handout uses a different scientific format, so follow your course. Reed also advises citing textbooks rarely, so the textbook carries only the general enzyme background, and every claim about catalase, the assay and potatoes rests on a journal article. Our guide to the APA reference page explains each entry. If your course asks for AMA, the numbered style of JAMA and many health-science programs, see our guide to AMA in-text citations and references. For a chemistry course, our ACS citation style guide shows the superscript numbers and the reference format.
How do you write a lab report?
Write from your own understanding of the experiment, not from the lab handout. Draft the methods and results first, since they record what happened, then build the introduction and discussion around them, and write the abstract and title last. The UNC Writing Center notes that many writers find drafting the methods and results first clarifies the experiment as a whole.
- Methods: what you did, in the past tense, including anything you changed from the handout.
- Results: means with a measure of spread, one display per data set, and two or three sentences on the trends.
- Introduction: from general background to your hypothesis, in your own words; Hamilton warns against copying the handout’s.
- Discussion: answer the hypothesis, explain surprises, name specific limits and connect to your sources.
- Abstract, title and references: one sentence from each section, then check that every citation is listed and every entry cited.
Should a lab report be written in past or present tense?
Mostly past tense. What you did and found happened once, in your lab, so the methods and results use the past. Established knowledge and statements about what your results mean take the present tense, so most sections mix the two. Where guides disagree, follow your instructor.
The University of Washington’s Psychology Writing Center gives the split by section: the introduction uses present for theory, past for earlier studies and future for hypotheses; the method and results use past; the discussion uses past for your findings and present for relating them to other work. Hamilton’s biology handout sums it up as “past tense, active voice”. Chemistry guides can lean the other way: Oregon State University’s asks for reports “mainly written in the present tense”.
How long should a lab report be?
Usually a few pages. Hamilton College’s biology handout sets two to five double-spaced pages of text, with tables, figures and references not counted, and adds that the best length is shorter than the maximum. The abstract is one paragraph of five to eight sentences in Reed’s instructions, and the introduction one to three paragraphs in Hamilton’s.
The sample above has about 1,100 words of text from abstract to discussion, around four double-spaced pages, plus a figure and a table. Never pad a short report to reach a page limit.
How do you write the discussion of a lab report?
Begin by saying whether the data supported your hypothesis and why. Then deal with anything unexpected, name the specific limits of your design and how they could affect the result, relate your findings to earlier work, and end with what the results mean or what to test next. Move from your experiment outward.
The UNC Writing Center says a weakness belongs in the report only if you are fairly sure it happened and can explain how it affected your data. Hamilton’s handout adds that if you list sources of error, you should estimate how much each one matters, and Oregon State’s chemistry guide prefers a number to words like “a little”. A research paper’s discussion makes the same moves at greater length; our discussion section guide breaks it into eight moves, with two published examples. Saying why your data supports your claim is the step school science calls reasoning, in the claim, evidence and reasoning framework.
Is a chemistry lab report example any different?
The structure is the same: introduction, methods, results, discussion and references. The conventions differ. Oregon State’s chemistry guide prefers the present tense for data analysis and the third person, wants error estimated in numbers, and notes that instructors differ in what they expect, so read your course handout first.
To adapt the catalase report for a chemistry course, write its analysis sentences in the present tense (“Figure 1 shows that foam height is highest at 37 °C of the five temperatures tested”). If your instructor wants the third person, rewrite the “We measured” sentences with the measurement as the subject (“Foam height was measured after 2 min”).
What is the difference between a lab report and a research paper?
A lab report records one experiment, usually assigned, for an instructor and classmates; a research paper reports original work or a synthesis of sources for a wider academic audience. Both use introduction, methods, results and discussion, but a lab report has a shorter introduction, cites fewer sources and is judged partly on whether you understood the experiment.
The UNC Writing Center frames it as audience: journal authors write for professionals, while a student writes for peers and the lab instructor and has to show an understanding of the context. A research paper has more to plan, so our research paper outline starts from a fuller template. Our guide on how to write a results section shows how a paper reports its statistics and themes, with two published results sections annotated.
What are the most common lab report mistakes?
The common ones: results text that only points at a table, a methods section copied from the handout as commands, results reported in the methods, the same data in both a table and a graph, a discussion that says the experiment “proved” the hypothesis, and sources of error listed without their size. Each breaks a rule the writing-center guides state outright.
| Mistake | Fix | Source |
|---|---|---|
| Results text that only says “Table 2 shows…” | State the finding and cite the table: “Most students had type O blood, while the fewest had type AB (Table 2)” | Hamilton |
| Methods written as commands from the handout | A past-tense narrative with units and sample sizes | UNC, Reed |
| Results reported in the methods | Methods say what you measured; results say what you found | Hamilton, UNC |
| The same data in a table and a graph | Choose one; a graph for trends | Reed |
| “The experiment proved the hypothesis” | “The data supported the hypothesis” | UNC |
| Sources of error listed without their size | Estimate how much each could change the result | Hamilton |
Where Papero fits
Papero is an AI writing workspace for students and researchers. Its outline builder can start a document from a standard IMRaD template: Introduction, Methods, Results and Discussion, each with a three-line prompt. The Results prompt reads: the main findings, in the order of your questions; the tables or figures that show them; findings only, no interpretation yet. Rename Methods to Materials and Methods if your course uses that heading, and add the abstract above the introduction.
You can sign up free and paste a DOI such as the Iwase et al. paper’s; Papero formats the in-text citation and reference entry in any of nine styles, including APA 7. On the free plan the reference list is blurred and left out of exports; Plus makes it exportable. The research paper writing page shows the steps for a full paper. Check your course’s rules on AI help first: Hamilton’s handout says it is essential that you write your own report, and the data and the argument have to stay yours.
Frequently Asked Questions
Can you use “I” or “we” in a lab report?
It depends on the course. Hamilton College’s biology handout allows “I” when it makes the writing easier to read, while Oregon State’s chemistry guide prefers the third person but accepts “our data” for your own results. The UNC Writing Center notes there is no consensus and suggests asking your lab instructor.
What if my results did not support my hypothesis?
Report them as they are and say plainly that the hypothesis was not supported. The UNC Writing Center points out that there is no such thing as wrong data and warns against vague excuses, and Hamilton’s handout asks you to discuss both the results you expected and the ones you got.
Does a lab report need an abstract?
Often, but not always. Reed College’s instructions include an abstract of five to eight sentences in every complete report, and Hamilton College’s sample biology report has one, but the UNC Writing Center notes that only some instructors ask for it. When you include one, write it last, from the finished report.
Sources
- Hamilton College, Nesbitt-Johnston Writing Center, “Biology Lab Reports” (Biology Department handout, accessed October 2026): https://www.hamilton.edu/academics/centers/writing/writing-resources/lab-reports-for-biology
- Hamilton College, Sample Lab Report: Perception of Different Sugars by Blowflies (PDF, accessed October 2026): https://www.hamilton.edu/documents/Sample%20Bio%20Lab%20Report.pdf
- Reed College, Doyle Online Writing Lab, “Laboratory Report Instructions” (accessed October 2026): https://www.reed.edu/writing/paper_help/labreport.html
- The Writing Center, University of North Carolina at Chapel Hill, “Scientific Reports” (accessed October 2026): https://writingcenter.unc.edu/tips-and-tools/scientific-reports/
- University of Washington Psychology Writing Center, Style Points for Scientific Writing (PDF, accessed October 2026): https://psych.uw.edu/storage/writing_center/stylepoints.pdf
- Oregon State University, Writing Intensive Curriculum, “Chemistry Writing Guide: Guide and Tips” (accessed October 2026): https://wic.oregonstate.edu/chemistry-writing-guide-guide-and-tips
- Clark, M. A., Douglas, M., & Choi, J. (2018). Biology 2e. OpenStax. Sections 3.4, “Proteins”, and 6.5, “Enzymes”: https://openstax.org/books/biology-2e/pages/6-5-enzymes
- Iwase, T., Tajima, A., Sugimoto, S., Okuda, K., Hironaka, I., Kamata, Y., Takada, K., & Mizunoe, Y. (2013). A simple assay for measuring catalase activity: A visual approach. Scientific Reports, 3, Article 3081. https://doi.org/10.1038/srep03081
- Spychalla, J. P., & Desborough, S. L. (1990). Superoxide dismutase, catalase, and α-tocopherol content of stored potato tubers. Plant Physiology, 94(3), 1214–1218. https://doi.org/10.1104/pp.94.3.1214