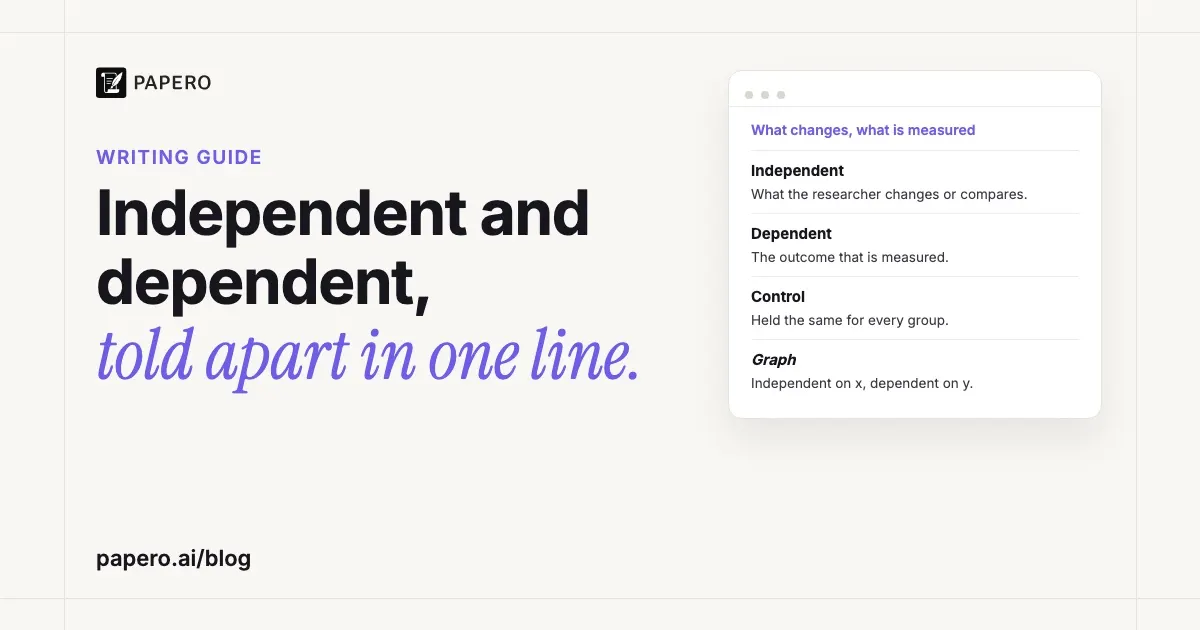
The independent variable is the one a researcher changes or compares; the dependent variable is the outcome they measure to see whether it changed. In a study of caffeine and reaction time, caffeine dose is independent and reaction time is dependent. This guide identifies independent and dependent variables in eight published studies, gives a one-line test for telling them apart, and shows which goes on each graph axis.
Key Takeaways
- The dependent variable depends on the independent one: ask what was changed or compared, and what was measured.
- In an experiment the researcher sets the independent variable. In an observational study both are measured as they are, so the result shows an association, not a cause.
- A control group is one level of the independent variable; a control variable is kept the same or adjusted for; a confounder is a third variable linked to both.
- The independent variable goes on the x-axis. Economics is the usual exception, with price on the vertical axis, and time is not automatically x: when time is the outcome, it goes on y.
What is the difference between independent and dependent variables?
The independent variable is the presumed cause: the condition a researcher sets, or the characteristic they compare groups on. The dependent variable is the presumed effect: the outcome they measure. OpenStax’s psychology textbook puts the relationship in one line: the dependent variable depends on the independent variable. Change the first and you expect the second to move; the reverse should make no sense.
| Independent variable | Dependent variable | |
|---|---|---|
| Role | The presumed cause | The presumed effect |
| Other names | Explanatory variable; condition or treatment | Response variable, predicted variable, outcome |
| In an experiment | Set by the researcher, at two or more levels | Measured after the change |
| In an observational study | Measured as it already is (age, steps walked) | Measured at the same time or later |
| Question it answers | What did I change or compare? | What did I measure? |
| On a graph | x-axis (horizontal) | y-axis (vertical) |
| Caffeine example | Dose: 0 mg or 200 mg | Reaction time in milliseconds |
Statistics textbooks say “explanatory” and “response”; the National Library of Medicine describes the dependent variable as “the disease or outcome of interest for the study”. “Independent” only means the variable does not depend on the other one in the study at hand. NCES’s Kids’ Zone gives age as an example, since what people eat or how much television they watch “aren’t going to change a person’s age”. The glossary entry on variables in research covers the other types and the levels of measurement.
Independent and dependent variable examples
Every example below has the same shape: one thing that differs between conditions or people, and one outcome measured the same way for all of them. The last column lists control variables, the things kept the same or adjusted for so that only the independent variable differs. These examples were written for this article; examples from published studies follow in the next section.
| Field | Study question | Independent variable | Dependent variable | Keep the same |
|---|---|---|---|---|
| Biology | Does fertiliser change how tall bean plants grow? | Fertiliser per pot: 0, 5 or 10 g | Height after 3 weeks (cm) | Pot size, soil, water, light |
| Psychology | Does sleep loss slow reaction time? | Hours slept: 4 or 8 | Reaction time (ms) | Time of day, caffeine |
| Medicine | Does a new drug lower blood pressure more than a placebo? | Pill: drug or placebo | Systolic blood pressure after 8 weeks | Measurement method |
| Sociology | Do students who commute join fewer campus clubs? | Commuter or resident (observed) | Clubs joined | Year and course, adjusted for |
| Economics | Does a price rise cut a café’s coffee sales? | Price per cup | Cups sold per day | Weekday, weather |
The sociology row is observational: nobody can assign students to commute. The economics row can be an experiment, if one café changes its price on purpose, or observational, if you compare cafés, where demand can also push prices up. Each value of an independent variable is a level, so three amounts of fertiliser make one variable with three levels.
Examples from published studies
Journal articles seldom label their variables in the title. The abstract is the place to look, because it says what was changed or compared and what was measured. The eight studies below are open-access papers published under a CC BY licence. In five, the authors name both variables themselves; in the other three, a “we manipulated” or “randomly assigned” sentence makes the independent variable explicit.
| Study | Field and design | Independent variable | Dependent variable |
|---|---|---|---|
| Pajkossy & Racsmány (2019) | Psychology, experiment | Word pairs learnt in a row: 2, 4 or 8 | Recall; pupil size |
| Heitmann et al. (2018) | Education, experiment | Learning activity: four conditions | Posttest one week later |
| Huang et al. (2024) | Medicine, randomised trial | VR plus usual rehabilitation, or usual rehabilitation | Arm function (FMA-UE); Barthel Index |
| Egerer & Philpott (2022) | Ecology, field experiment | Garden management: tidy or messy | Natural enemy community; pest removal |
| Ramadan et al. (2018) | Ergonomics, experiment | Holding style, carrying technique, bag weight | Cardiac cost, muscle activity, foot pressure, discomfort |
| Hortélio et al. (2026) | Public health, cross-sectional | Daily step count | Diabetes |
| Tharakan & Ford (2026) | Urban sociology, observational | Weeks to respond to a pothole report | Life satisfaction |
| Iannuzzi et al. (2026) | Surgery, observational | Number of procedures performed | Docking time |
Ramadan et al. come up again in the section on more than one variable, and Iannuzzi et al. in the section on graph axes; the other six follow.
Psychology: one variable, three levels. Pajkossy and Racsmány (2019) wrote:
“Importantly, we manipulated the size of the learning set: participants either learnt two, four or eight word-pairs in a row.”
Set size is the independent variable; recall after a short delay and pupil size are the dependent variables. The authors report: “As expected, increasing set size resulted in larger forgetting.”
Education: no do-nothing group. Heitmann et al. (2018) ran “an experiment with N = 200 university students who were randomly assigned to (a) adaptive testing, (b) non-adaptive testing, or note-taking (c) without or (d) with focus guidance.” The learning activity is the independent variable and a posttest one week later is the dependent variable. Both testing groups outperformed the note-taking groups, which the authors chose as stronger controls than the usual restudy condition.
Medicine: the authors name all three kinds of variable. Huang et al. (2024) randomly assigned 40 stroke patients to immersive virtual reality plus conventional rehabilitation, or to conventional rehabilitation alone:
“with the FMA-UE/BI at post-intervention or at follow-up, respectively, as the dependent variable, the two groups as the independent variable, baseline FMA-UE/BI, age, sex, site, time since onset, hypertension and diabetes as covariates.”
The covariates are control variables: age or time since the stroke cannot be held constant, so the analysis adjusts for them. After treatment, the virtual reality group’s FMA-UE (upper-extremity Fugl-Meyer) scores were 9.1 points higher on average than the control group’s.
Ecology: an outcome that barely moved. Egerer and Philpott (2022) made community-garden plots tidy with woodchip mulch or messy by adding weedy plants to paths, then “measured for differences in natural enemy biodiversity (abundance, richness, community composition), and sentinel pest removal”. The manipulation “did not significantly alter natural enemy or herbivore abundance”, although the make-up of the natural enemy community did shift, and messy plots immediately removed fewer aphids. An abundance count that does not change is still a result.
Public health: an independent variable nobody assigned. Hortélio et al. (2026) analysed 12,636 adults from the ELSA-Brasil cohort in a cross-sectional study:
“DM was the dependent variable, assessed by laboratory tests, and daily step count was the independent variable, measured by accelerometry.”
Steps were measured, not assigned, so the authors word their finding as an association: step count “appears to be associated with a protective effect” against diabetes mellitus (DM). Our guide to the cross-sectional study explains why that design supports an association but not a cause.
Urban sociology: turning an idea into a number. Tharakan and Ford (2026), studying Chicago:
“We model local governance, our independent variable, as the number of weeks for the municipality to respond to pothole service requests reported to the city’s non-emergency services system. Our dependent variable was life satisfaction, measured by the Cantril Ladder.”
Local governance cannot be measured directly, so the authors chose a stand-in. Deciding how each variable will be measured is called operationalisation; the variable glossary entry linked above gives a worked example. Whether a stand-in like this captures the idea it replaces is a question of validity, which our guide to reliability vs validity works through with published numbers.
How do you identify the independent and dependent variable?
Ask two questions: what was changed or compared, and what was measured to see the effect? The first answer is the independent variable and the second is the dependent variable. Then check with one sentence: “[dependent variable] depends on [independent variable]”. If it makes sense only one way round, you have them right. Test score depends on study time; study time does not depend on test score.
NCES’s Kids’ Zone phrases the check as “(Independent variable) causes a change in (Dependent Variable) and it isn’t possible that (Dependent Variable) could cause a change in (Independent Variable).” In someone else’s study, the dependent variable is the outcome the results report on, such as a score, a time or a count of events.
The test breaks down when neither variable plausibly causes the other. OpenStax’s example is ice cream sales and crime, which rise together, most likely because both go up in warm weather. Then the research question decides: whatever you want to explain is the dependent variable. Our research question examples show how wording points to a design, and a hypothesis statement names both variables and the expected result.
Independent and dependent variables in an experiment vs an observational study
In an experiment the researcher sets the independent variable, ideally assigning people or plots to its levels at random, so a difference in the dependent variable can be put down to it. In an observational study both variables are measured as they already are. The labels are the same in both designs, but an observational result shows only an association, because something else could explain it.
OpenStax explains why: “Random assignment allows us to assume that any differences observed between experimental and control groups result from the manipulation of the independent variable.” Some independent variables cannot be assigned. In OpenStax’s example of sex and spatial memory, “you cannot directly control a person’s sex”, so the design is quasi-experimental and supports no cause-and-effect claim. Ethics rules out others: the NLM notes that “it would be unethical to expose a randomized group of people to high levels of vehicle exhaust”. The glossary entry on experimental design compares true, quasi- and natural experiments. Experiments and observational studies are both quantitative designs; how they differ from interview and focus-group research is covered in our guide to qualitative vs quantitative research.
Control variables, control groups and confounders
Control variables, control groups and confounders sound alike and mean different things. A control variable is a factor kept the same for everyone, or measured and adjusted for, so it cannot explain the result. A control group gets no treatment, a placebo or the usual treatment, which makes it one level of the independent variable. A confounder is a third variable, linked to both the independent and the dependent variable, that offers another explanation.
OpenStax’s biology textbook shows the control group as a level. Half of a set of ponds get phosphate each week and half get a salt that algae do not use: “The variable here is the phosphate (or lack of phosphate)”, and the salt ponds are the control group.
The NLM defines a confounder as “a separate factor that is related with both the dependent and the independent variables”. In its example of vehicle exhaust and childhood asthma, cigarette smoke or pollution from nearby factories could explain the link; in OpenStax’s ice cream example, temperature does. Random assignment makes systematic differences between groups unlikely; observational studies have to name confounders and adjust for them. Our guide to confounding variables works through a published study where one reversed the result, and five ways to control them.
Which variable goes on which axis?
Put the independent variable on the x-axis, the horizontal one, and the dependent variable on the y-axis, the vertical one, so readers see the outcome change as the cause moves from left to right. The University of Maryland’s MathBench graphing primer states the convention for science graphs, and statistics textbooks write it as algebra: in y = a + bx, x is independent.
Our lab report example follows the convention, with temperature along the bottom of its figure and foam height up the side. One trap and one exception are worth knowing.
Time is not always the x variable. MathBench warns that “sometimes the amount of time a process takes is the EFFECT of a treatment”, and then time goes on the y-axis. Iannuzzi et al. (2026), studying 68 operations with a new surgical robot, analysed “the association between the number of consecutive procedures (independent variable) and docking time (dependent variable).” Procedures go along the bottom; docking time, which fell as procedures added up, goes up the side.
Economics has its own habit. OpenStax’s Principles of Economics writes demand as Qd = 16 – 2P, quantity as a function of price, and still graphs it with price on the vertical axis (“Since P is on the vertical axis, it is easiest if you solve each equation for P”). In an economics course, follow your textbook.
When an independent variable has only a few levels, a table of group means can replace a graph, laid out as our APA table format guide shows.
Can a study have more than one independent or dependent variable?
Yes. A design with two or more independent variables is called factorial, and each combination of levels is a separate condition. Several dependent variables let one study measure several outcomes and report each on its own. The cost is size: every extra independent variable multiplies the number of conditions, and every extra dependent variable adds another analysis to run and report.
Ramadan et al. (2018) studied carrying shopping bags while walking:
“A three-way repeated measures experiment was conducted for the purpose of the study. The independent variables were holding style, carrying technique, and shopping bags’ weights. The dependent variables were cardiac cost, muscles’ activities as a percentage of their maximum voluntary contraction’s EMG (%MVC), peak plantar pressure (PPP), and discomfort rating.”
“Three-way” means three independent variables; “repeated measures” means the same participants walked under every condition. Carrying bags in both hands at the sides with a bag holder came out best on all four outcomes. Some variables are neither independent nor dependent: the Chicago study tested neighbourhood race and ethnicity as a moderator, which changes how strongly one variable affects the other.
What are the most common mistakes?
Most mistakes come from naming something that cannot be measured, counting levels as variables, or calling a control group a control variable. The rest are habits: time put on the x-axis when it is the outcome, or causal language for an observational result. Each row pairs a mistake with a version a marker would accept.
| Mistake | Example | Fix |
|---|---|---|
| A topic instead of a measure | Dependent variable: sleep | Hours slept, from a sleep diary |
| Levels counted as variables | Independent variables: 2, 4 and 8 word pairs | One variable, set size, with three levels |
| Control group called a control variable | Control variable: the placebo group | The placebo group is a level of the independent variable |
| Time on the x-axis by habit | Docking time along the bottom | Time goes up the side when it is the outcome |
| Cause claimed from observation | “Walking prevents diabetes” | “More daily steps were associated with lower odds of diabetes” |
In a write-up, the hypothesis that names both variables sits at the end of the introduction, as our research paper outline template shows, and how you measured each variable goes in the method section. Our hypothesis examples take five published hypotheses apart.
Where Papero fits
Papero is an AI writing workspace for students and researchers. When you describe a research paper, its outline builder can start from a standard IMRaD structure with a prompt for each section. The Methods prompt asks for “Design, participants or materials”, “Procedure and measures” and “How the data were analysed”, which is where your variables, their levels and how you measured them are written up.
Find papers searches more than 250 million papers through OpenAlex, which helps you find earlier studies that measured the same outcome. The research paper writing page walks through the process to Word export, and you can sign up free. Choosing and defining the variables stays your job.
Frequently Asked Questions
What are the independent and dependent variables in an experiment?
In an experiment, the independent variable is what the researcher deliberately changes between groups, and the dependent variable is what the researcher measures afterwards. In a trial of a blood pressure drug, drug or placebo is the independent variable and blood pressure after treatment is the dependent variable.
How do you explain independent and dependent variables to a child?
The independent variable is the thing you change and the dependent variable is the thing you watch to see what happens. If one plant gets more water than another, the water is what you changed and the plant’s height is what you watch. The water can change the height, but the height cannot change the water.
What is a dependent variable?
A dependent variable is the outcome a study measures to see whether it changes with the independent variable. In an experiment on sleep loss and reaction time, reaction time is the dependent variable.
Is time always the independent variable?
No. Time is the independent variable when a study tracks how something changes over days or years, and the dependent variable when the time a task takes is the outcome. In a 2026 study of a surgical robot, the number of procedures performed was the independent variable and docking time was the dependent variable.
What is the difference between independent and dependent samples?
Independent and dependent samples describe how groups of participants relate, not which variable is which. Independent samples are unrelated groups, such as two different classes. Dependent, or paired, samples are linked, such as the same students tested before and after a course. A study with either kind of sample still has an independent and a dependent variable.
Sources
- Egerer, M., & Philpott, S. M. (2022). ‘Tidy’ and ‘messy’ management alters natural enemy communities and pest control in urban agroecosystems. PLOS ONE, 17(9), Article e0274122. https://doi.org/10.1371/journal.pone.0274122
- Fowler, S., Roush, R., & Wise, J. (2013). Concepts of biology, Section 1.2, The process of science. OpenStax. https://openstax.org/books/concepts-biology/pages/1-2-the-process-of-science
- Greenlaw, S. A., Shapiro, D., & MacDonald, D. (2022). Principles of economics 3e, Appendix A, The use of mathematics in principles of economics. OpenStax. https://openstax.org/books/principles-economics-3e/pages/a-the-use-of-mathematics-in-principles-of-economics
- Heitmann, S., Grund, A., Berthold, K., Fries, S., & Roelle, J. (2018). Testing is more desirable when it is adaptive and still desirable when compared to note-taking. Frontiers in Psychology, 9, Article 2596. https://doi.org/10.3389/fpsyg.2018.02596
- Hortélio, M., de Almeida, M. D. C. C., Alvim de Matos, S. M., Pitanga, C. P. S., Queiroz, C. O., & Pitanga, F. J. G. (2026). Association between daily steps measured by accelerometry and diabetes in ELSA-Brasil participants. International Journal of Environmental Research and Public Health, 23(3), Article 346. https://doi.org/10.3390/ijerph23030346
- Huang, Q., Jiang, X., Jin, Y., Wu, B., Vigotsky, A. D., Fan, L., Gu, P., Tu, W., Huang, L., & Jiang, S. (2024). Immersive virtual reality-based rehabilitation for subacute stroke: A randomized controlled trial. Journal of Neurology, 271(3), 1256–1266. https://doi.org/10.1007/s00415-023-12060-y
- Iannuzzi, A., Ragusa, A., De Giuseppe, A., Prata, F., Tedesco, F., Mirto, B. F., Machiella, F., Muto, G., Dente, D., Muto, G., & Papalia, R. (2026). Learning curve of docking time in robot-assisted radical prostatectomy with the Hugo RAS system: How many procedures to achieve efficiency? Journal of Clinical Medicine, 15(9), Article 3509. https://doi.org/10.3390/jcm15093509
- Illowsky, B., & Dean, S. (2023). Introductory statistics 2e, Section 12.1, Linear equations, and Section 12.3, The regression equation. OpenStax. https://openstax.org/books/introductory-statistics-2e/pages/12-1-linear-equations and https://openstax.org/books/introductory-statistics-2e/pages/12-3-the-regression-equation
- Illowsky, B., & Dean, S. (2023). Introductory statistics 2e, Chapter 10, Hypothesis testing with two samples (introduction). OpenStax. https://openstax.org/books/introductory-statistics-2e/pages/10-introduction
- National Center for Education Statistics. (n.d.). What are independent and dependent variables? NCES Kids’ Zone. https://nces.ed.gov/nceskids/help/user_guide/graph/variables.asp
- National Library of Medicine. (n.d.). Dependent and independent variables. In Finding and using health statistics. https://www.nlm.nih.gov/oet/ed/stats/02-200.html
- Pajkossy, P., & Racsmány, M. (2019). How the size of the to-be-learned material influences the encoding and later retrieval of associative memories: A pupillometric assessment. PLOS ONE, 14(12), Article e0226684. https://doi.org/10.1371/journal.pone.0226684
- Ramadan, M. Z., Khalaf, T. M., Ragab, A. M., & AbdElgawad, A. A. (2018). Influence of shopping bags carrying on human responses while walking. Journal of Healthcare Engineering, 2018, Article 5340592. https://doi.org/10.1155/2018/5340592
- Spielman, R. M., Jenkins, W. J., & Lovett, M. D. (2020). Psychology 2e, Section 2.3, Analyzing findings. OpenStax. https://openstax.org/books/psychology-2e/pages/2-3-analyzing-findings
- Tharakan, D. P. L., & Ford, T. N. (2026). Responsiveness to city service requests, life satisfaction, and horizontal inequality: Does good local governance improve subjective well-being for all? International Journal of Environmental Research and Public Health, 23(1), Article 132. https://doi.org/10.3390/ijerph23010132
- University of Maryland. (n.d.). Choose your x and y carefully. In MathBench: A graphing primer. https://mathbench.umd.edu/modules/visualization_graph/page02.htm