A hypothesis is a testable prediction about how two or more variables are related, written before you collect the data. A good one names who or what you are studying, what you will change or compare, what you will measure, and which result you expect. Below are hypothesis examples sorted by type and by field, five hypotheses quoted from published studies with what happened to them, null and alternative pairs, and four weak hypotheses rewritten into strong ones.
Key Takeaways
- A usable hypothesis has four parts: a population, an independent variable, a measurable outcome and an expected direction or difference.
- “If … then” is a format, not a requirement. All five published hypotheses below are one-sentence statements built on “we hypothesized that”.
- Every statistical test pairs a null hypothesis (no effect) with an alternative (an effect). The null is the one that contains an equals sign.
- A hypothesis that the data do not support is still a result. One of the published examples below was contradicted on one of its measures, and the paper reported it.
What does a good hypothesis look like?
A good hypothesis can be shown wrong by a result you could actually collect. It names the group, the thing that varies, the outcome and how the outcome is measured, and it predicts one relationship. Compare “sleep is important for memory”, which no single result could refute, with a sentence that says which students, how much sleep, which test and which score.
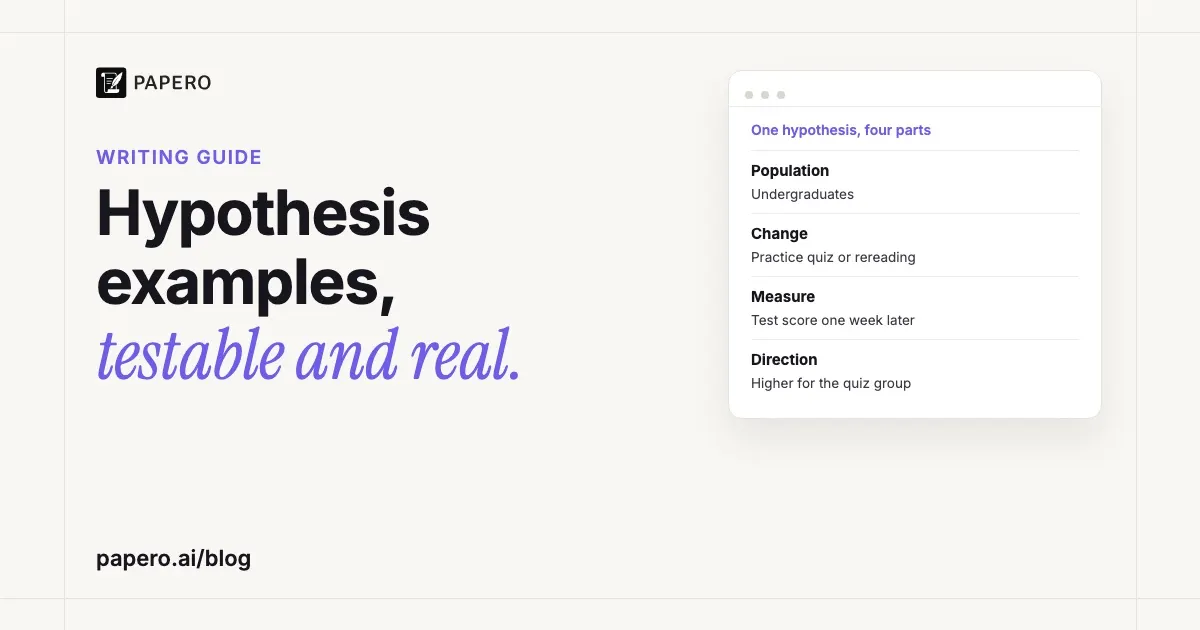
Here is one hypothesis taken apart:
Undergraduates who take a practice quiz after reading a chapter will score higher on a test of that chapter one week later than undergraduates who reread it.
| Part | In the example | Why it matters |
|---|---|---|
| Population | Undergraduates | Says who the result applies to |
| Independent variable | Practice quiz or rereading | The thing you change or compare |
| Dependent variable | Score on a test one week later | The outcome, and when you measure it |
| Direction | Higher for the quiz group | Tells you which result would support it and which would not |
If the population, the variables or the expected result is missing, the hypothesis is not ready; a non-directional hypothesis states a difference instead of a direction. The glossary entry on the hypothesis statement defines each part and gives sentence starters; the rest of this guide shows each part in use. To tell the two variables apart in a published study, see independent and dependent variables, with eight real studies.
Hypothesis examples by type
The type of a hypothesis depends on how many variables it involves, whether it predicts a direction, and whether it claims cause or only association. Most real hypotheses combine labels: the practice-quiz example above is simple, directional and causal at once. The table gives one example of each label so you can see what changes between them.
| Type | Example | What makes it this type |
|---|---|---|
| Simple | Seedlings given 16 hours of light a day will be taller after three weeks than seedlings given 8 hours. | One independent and one dependent variable |
| Complex | Daily screen time and caffeine intake will each predict shorter sleep in teenagers. | Two or more variables on one side |
| Directional | Students who study in 30-minute blocks will recall more terms than students who study for 90 minutes straight. | States which group does better |
| Non-directional | Recall will differ between students who study in 30-minute blocks and students who study for 90 minutes straight. | Predicts a difference, not its direction |
| Associative | Neighbourhoods with more street trees will have lower summer surface temperatures. | Variables move together; no cause is claimed |
| Causal | Text-message reminders will increase the share of patients who attend follow-up appointments. | One variable is changed to produce an effect |
| Null (H₀) | Text-message reminders will not change follow-up attendance. | Predicts no effect; the statistical test assumes it |
| Alternative (H₁) | Text-message reminders will change follow-up attendance. | The claim the test looks for evidence of |
Directional hypotheses need a reason to expect the direction, such as earlier findings or a theory. If you have none, write the non-directional version. A causal hypothesis also commits you to a design that can show cause, usually an experiment that randomly assigns enough people or groups to each condition; with survey data alone, phrase it as an association.
Hypothesis examples in science
School and college science hypotheses usually predict what will happen to one measurement when you change one condition and hold the rest constant. The “if … then” form fits these well, because the “if” names the change and the “then” names the measurement. Each example below could be tested with simple equipment in a few days or weeks.
- If tomato seedlings receive 16 hours of light a day instead of 8, then they will be taller after 21 days.
- If the water temperature is raised from 20 °C to 40 °C, then a sugar cube will dissolve faster.
- If bread is stored in a refrigerator instead of at room temperature, then visible mould will take longer to appear.
- If the mass of a pendulum’s bob is doubled while its length stays the same, then the time of one swing will not change.
- If yeast is mixed with warm sugar water instead of warm plain water, then more gas will collect in a balloon over the bottle in 30 minutes.
- If a plant is watered with salt water instead of tap water, then its leaves will wilt sooner.
Example 4 is worth a second look. It predicts no difference, so if you test it statistically your prediction is the null hypothesis itself, and a non-significant result alone will not support it. You need measurements precise enough to rule out any difference that would matter. A prediction of “no change” is still a hypothesis when you have a reason for it, but it is the hardest kind to support. Our lab report example shows where a hypothesis like these sits in a full report, and how the discussion answers it.
Research hypothesis examples from published studies
Journal articles seldom use the “if … then” form. The hypothesis is often one sentence near the end of the introduction, and many start “We hypothesized that”. The five below are quoted from the abstracts of open-access papers, from five fields, with what the authors reported afterwards. Reading what happened to a hypothesis is the fastest way to see what made it testable.
1. Psychology and physiology. Thoma et al. (2013) randomly assigned 60 women to hear relaxing music (RM), the sound of rippling water (SW) or rest without sound (R) before a stress test:
“We hypothesized that listening to RM prior to the stress test, compared to SW or R would result in a decreased stress response across all measured parameters.”
What happened: cortisol, one of those parameters, went the other way. Cortisol concentrations were highest in the music group and lowest in the water group. After the stressor, salivary alpha-amylase returned to baseline faster after music than after rest, and heart rate and the psychological measures did not differ between groups. “Across all measured parameters” made the hypothesis easy to test and, in this case, easy to contradict, which is exactly what a hypothesis is for.
2. Medicine. Lorig et al. (2010) tested an online self-management program for type 2 diabetes:
“We hypothesized that people with type 2 diabetes in an online diabetes self-management program, compared with usual-care control subjects, would 1) demonstrate reduced A1C at 6 and 18 months, 2) have fewer symptoms, 3) demonstrate increased exercise, and 4) have improved self-efficacy and patient activation.”
What happened: at 6 months, the abstract reports better A1C, patient activation and self-efficacy for program participants than for the usual-care group. At 18 months, self-efficacy and patient activation were still better, but A1C was not measured, and the e-mail reinforcement the authors also tested showed no improvement. The abstract also reports no changes in the other health or behavioural indicators, which leaves the symptom and exercise predictions unsupported. Numbering the predictions let the authors report each one separately, a good model when one study tests several outcomes.
3. Neuroscience. Kanai et al. (2012) studied loneliness and brain structure:
“Here, we hypothesized that individual differences in loneliness might be reflected in the structure of the brain regions associated with social processes.”
What happened: lonelier people had less grey matter in the left posterior superior temporal sulcus, an area involved in basic social perception, and they also had more difficulty processing social cues. Note the wording “might be reflected”: this is an associative hypothesis. The study could show that loneliness and brain structure go together, not which one causes the other.
4. Social neuroscience. Younger et al. (2010) asked why looking at a partner’s photo reduces pain, an effect an earlier study had already shown:
“We hypothesized that pain relief evoked by viewing pictures of a romantic partner would be associated with neural activations in reward-processing centers.”
What happened: both the partner photos and a word-association distraction task reduced self-reported pain, but only the partner task was associated with activity in reward systems. The data supported the hypothesis, and because it predicted a specific brain pattern, the authors could separate two tasks that had the same effect on pain.
5. Evolutionary biology. Bergland et al. (2014) tracked fruit flies in an orchard across seasons:
“We hypothesized that environmental fluctuations among seasons in a North American orchard would impose temporally variable selection on Drosophila melanogaster that would drive repeatable adaptive oscillations at balanced polymorphisms.”
What happened: the authors identified hundreds of genetic variants whose frequency oscillated between seasons and linked them to changes in climate. A hypothesis this technical still has the same parts as the seedling example: a population (one fly species in one orchard), a cause (seasonal change), and a measurable outcome (allele frequencies rising and falling in a repeatable pattern).
The pattern across all five: one sentence, a comparison or a relationship, and an outcome someone could measure. Two name the population in the sentence itself; the other three leave it to the method section. None of them says “prove”. Each also appears in its paper’s abstract as the aim, which is where most readers meet it; our abstract example guide shows that structure.
Null and alternative hypothesis examples
Every statistical test compares two hypotheses. The null hypothesis (H₀) says there is no difference or no effect; the alternative (H₁, also written Hₐ) says there is one. The test asks whether your sample gives enough evidence to reject the null. In OpenStax’s notation, the null contains an equals sign (=, ≤ or ≥) and the alternative never does; many researchers write a plain = in the null even for one-sided tests.
| Research question | H₀ | H₁ |
|---|---|---|
| Is the mean GPA at American colleges different from 2.0? | μ = 2.0 | μ ≠ 2.0 |
| Do students take less than five years to graduate, on average? | μ ≥ 5 | μ < 5 |
| Do more than 6.6% of U.S. students take advanced placement exams? | p ≤ 0.066 | p > 0.066 |
| Is the number of hours spent revising related to exam score? | ρ = 0 | ρ ≠ 0 |
| Do text reminders change attendance at follow-up appointments? | Attendance is the same with and without reminders | Attendance differs with reminders |
The first three pairs are worked examples from OpenStax’s Introductory Statistics; the fourth and fifth follow the same pattern. Notice how the wording of the question picks the symbol: “different from” gives ≠, “less than” gives <, “more than” gives >. The glossary entry on the null hypothesis explains how the test decides between them and what “fail to reject” means. When you report the result, the group means and the test statistic often go in a table, laid out as our APA table format guide shows.
Hypothesis examples by field
The same structure works in every field; only the variables change. These examples are written for student projects, where the outcome has to be something you can measure with the time and access you have. Each one names a group, a comparison and an outcome you could record within a term.
| Field | Hypothesis |
|---|---|
| Education | Students who explain a worked example aloud to a partner will solve more transfer problems than students who study the example alone. |
| Psychology | People who write down three things they are grateful for each evening for two weeks will report higher life satisfaction than people who write about their day. |
| Public health | Adults who live within 500 metres of a park will report more minutes of weekly physical activity than adults who live further away. |
| Sociology | First-generation students will report a lower sense of belonging in their first semester than students whose parents went to university. |
| Business | Product pages that show the number of items left in stock will have a higher purchase rate than pages that do not. |
| Environmental science | Soil samples from fields under no-till farming will contain more earthworms per square metre than samples from ploughed fields. |
| Computer science | Developers who use a code linter will submit pull requests with fewer review comments about style than developers who do not. |
| Linguistics | Bilingual children will name pictures more slowly in their less-used language than in their dominant language. |
Several of these are associative (the park, belonging, linter and bilingual examples) because you cannot randomly assign people to live near a park, to a family background or to a dominant language, and developers choose their own tools. If your study can only observe, write the hypothesis as a relationship, not a cause.
How do you turn a weak hypothesis into a strong one?
Find the part that cannot be measured or cannot fail, and replace it with something specific. Four problems come up again and again: a vague outcome, an opinion instead of a prediction, two predictions bundled without numbers, or no comparison. Each rewrite below fixes one of them and keeps the original idea.
| Weak | Problem | Strong |
|---|---|---|
| Social media affects teenagers. | Vague: which teenagers, which effect, measured how? | Teenagers who use social media for more than three hours a day will report more symptoms of anxiety on a standard questionnaire than teenagers who use it for less than one hour. |
| Online classes are worse than in-person classes. | An opinion; “worse” is not measured | Students in the online section of an introductory statistics course will have lower final exam scores than students in the in-person section taught by the same instructor. |
| Exercise improves mood and sleep. | Two predictions bundled, unnumbered | (1) Adults who walk for 30 minutes a day for four weeks will report better mood than adults who do not. (2) They will also fall asleep faster, measured by a sleep diary. |
| Coffee makes people more alert. | No comparison and no measure | People who drink 200 mg of caffeine will have faster reaction times on a computer task 30 minutes later than people who drink a decaffeinated placebo. |
The third rewrite does what Lorig et al. did in their abstract: it numbers the predictions so each can be supported or contradicted on its own. Splitting them also tells you, before you start, that you need two measures.
Is a hypothesis the same as a prediction?
Not quite. In a strict sense, a hypothesis is a proposed explanation and a prediction is what you expect to observe if the explanation is true. OpenStax’s Biology 2e draws the line this way: “the classroom is warm because no one turned on the air conditioning” is a hypothesis, and “if the student turns on the air conditioning, then the classroom will no longer be too warm” is its prediction.
In practice, most coursework and most journal articles use “hypothesis” for the prediction itself, as all five published examples above do. Use whichever your instructor or field uses, but know the difference: when a marker asks for the reasoning behind your hypothesis, they are asking for the explanation part.
A research question comes before both. It asks what you want to know (“Does quizzing improve retention?”), and the hypothesis answers it in advance. Exploratory and qualitative studies often stop at the question and never state a hypothesis; the glossary entry on the research question covers how to write one. If you are planning the paper that will report your test, our research paper outline shows where the hypothesis sits: at the end of the introduction, after the literature review has shown the gap it fills. For research questions quoted from 15 published studies, sorted by design, see our research question examples.
Where Papero fits
Papero is an AI writing workspace for students and researchers, and you can sign up free. When you describe a research paper, its outline builder can start from a standard IMRaD structure, and the Introduction section’s prompt asks for three things a hypothesis has to follow from: the problem; what is already known and the gap; and your research question or aim.
Its citation search finds real scholarly papers for the sentence you are writing, which is where the “earlier findings” behind a directional hypothesis come from, and Review’s Claims check flags sentences that need a citation. The research paper writing page walks through the whole process. Papero suggests and formats; the hypothesis, the prediction and the decision about what would count as evidence against it stay yours.
Frequently Asked Questions
What is an example of a hypothesis?
“Undergraduates who take a practice quiz after reading a chapter will score higher on a test of that chapter one week later than undergraduates who reread it.” It names a population, two conditions to compare, an outcome measured at a set time, and the direction of the expected difference, so a single result could support or contradict it.
Can a hypothesis be written as a question?
No. A question is the research question; the hypothesis is your predicted answer to it, written as a statement. “Does caffeine improve reaction time?” is a question. “People who drink 200 mg of caffeine will react faster than people given a placebo” is a hypothesis.
What happens if your hypothesis is wrong?
You report it. A hypothesis is never proved; the data either support it or do not. Thoma et al. (2013) predicted that relaxing music would lower every stress measure, found the opposite for cortisol, and published the result. An unsupported hypothesis tells readers something the field did not know.
How many hypotheses should a research paper have?
As many as your research questions need, and no more. A short student project usually has one. A study with several outcomes numbers its predictions so each can be tested on its own, as Lorig et al. (2010) did with four. Each hypothesis needs its own measure and its own test, so every extra hypothesis adds work.
Do qualitative studies have a hypothesis?
Usually not. Qualitative and exploratory studies set out to describe or understand something rather than test a prediction, so they state research questions instead. Confirmatory quantitative studies, such as experiments and many surveys, are the ones that state hypotheses and test them statistically.
Sources
- Bergland, A. O., Behrman, E. L., O’Brien, K. R., Schmidt, P. S., & Petrov, D. A. (2014). Genomic evidence of rapid and stable adaptive oscillations over seasonal time scales in Drosophila. PLOS Genetics, 10(11), Article e1004775. https://doi.org/10.1371/journal.pgen.1004775
- Clark, M. A., Douglas, M., & Choi, J. (2018). Biology 2e, Section 1.1, The science of biology. OpenStax. https://openstax.org/books/biology-2e/pages/1-1-the-science-of-biology
- Illowsky, B., & Dean, S. (2023). Introductory statistics 2e, Section 9.1, Null and alternative hypotheses. OpenStax. https://openstax.org/books/introductory-statistics-2e/pages/9-1-null-and-alternative-hypotheses
- Kanai, R., Bahrami, B., Duchaine, B., Janik, A., Banissy, M. J., & Rees, G. (2012). Brain structure links loneliness to social perception. Current Biology, 22(20), 1975–1979. https://doi.org/10.1016/j.cub.2012.08.045
- Lorig, K., Ritter, P. L., Laurent, D. D., Plant, K., Green, M., Jernigan, V. B. B., & Case, S. (2010). Online diabetes self-management program: A randomized study. Diabetes Care, 33(6), 1275–1281. https://doi.org/10.2337/dc09-2153
- Thoma, M. V., La Marca, R., Brönnimann, R., Finkel, L., Ehlert, U., & Nater, U. M. (2013). The effect of music on the human stress response. PLOS ONE, 8(8), Article e70156. https://doi.org/10.1371/journal.pone.0070156
- Younger, J., Aron, A., Parke, S., Chatterjee, N., & Mackey, S. (2010). Viewing pictures of a romantic partner reduces experimental pain: Involvement of neural reward systems. PLOS ONE, 5(10), Article e13309. https://doi.org/10.1371/journal.pone.0013309