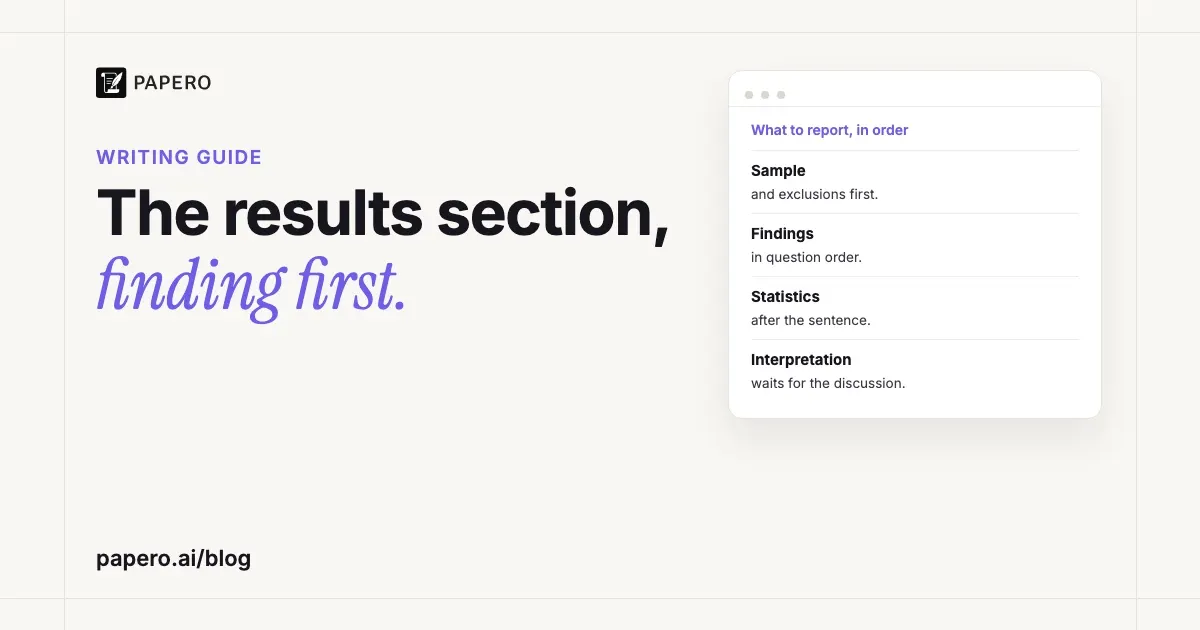
A results section reports what your study found, in the order of your research questions, without explaining why. It opens with who took part and any exclusions, gives descriptive statistics, then states each finding in a sentence followed by the numbers that support it, with tables and figures carrying the detail. This guide shows how to write a results section step by step, with APA’s statistics rules and two published results sections annotated.
Key Takeaways
- Report findings in the order of your research questions, main analyses first, using the terms from your methods.
- Write each finding as a plain sentence, then the statistics; never make the test the subject.
- Report results that did not support your hypothesis as fully as those that did.
- In APA style, give exact p values, write p < .001 for anything below .001, and add effect sizes and confidence intervals.
- Organise qualitative findings by theme, and say what each quotation shows.
What goes in a results section?
A results section holds four things: the sample that was analysed, descriptive statistics, the outcome of every analysis you said you would run, and the tables or figures that show them. Some fields add a short opening that restates the research question and a closing paragraph that summarises the key findings. Interpretation and methods details stay out, and comparison with earlier studies usually does too.
| Part | What to report | Who asks for it |
|---|---|---|
| Participant flow | How many took part at each stage, and who was excluded and why | APA JARS-Quant, “Participant Flow” |
| Descriptive statistics | Cases, means and standard deviations for each outcome and group | JARS-Quant, “Statistics and Data Analysis” |
| Main analyses | Each test, its exact p value, effect size and confidence interval | JARS-Quant; APA’s numbers and statistics guide |
| Secondary and exploratory analyses | Labelled as such, after the main ones | JARS-Quant (“clear differentiation”) |
| Tables and figures | Detail the text does not repeat, each mentioned in the text | APA’s statistics guide; UCI Libraries |
| Closing summary | One paragraph on the key findings | USC Libraries; San José State |
The Papero glossary entry on the results section gives the short definition; this guide covers the writing.
How do you write a results section, step by step?
Write the results after the analysis is finished and before the discussion. Work from your research questions, not from your output files: list each question or hypothesis, the analysis that answers it and the table or figure that shows it, then write one paragraph or subsection per question. The six steps below follow that order.
- Fix the order. Guides differ. Springer Nature puts results “in order of importance, not necessarily the order in which the experiments were performed”; Bahadoran and colleagues call the chronological order, with “subheadings that parallel methods”, the most straightforward, although their checklist also says to go from most to least important. Both hold if your methods already list the analyses by question, main ones first. Keep the headings and variable names of your methodology section.
- Start with the sample. Say how many people were recruited, how many were analysed, and why any were excluded. JARS-Quant asks for the “total number of participants in each group at each stage of the study”.
- Give descriptive statistics. Means and standard deviations, or counts and percentages, usually in Table 1.
- Report each analysis finding-first. Purdue OWL passes on Daryl Bem’s pattern: “Provide the answer/result in plain English”, then “the statistic that supports your plain English answer”. Bahadoran and colleagues add that “the main verbs should describe results, not methods”.
- Decide text, table or figure. Bahadoran and colleagues offer a rule of thumb: “if you want to present three or fewer numbers, you should use a sentence; otherwise, you consider a table or a graph.” Use the text for the pattern and the one or two key values, and point to the table for the rest.
- Report what did not work. Non-significant and unexpected results go in, with the same statistics as the rest. USC’s guide is blunt: “Do not ignore them.”
How do you report statistics in APA style?
APA asks for the test statistic, its degrees of freedom, the exact p value for every test, and an effect size with its confidence interval wherever one can be computed. Statistical symbols are italic, a p value smaller than .001 is written p < .001, and values that cannot exceed 1, such as correlations and p values, drop the leading zero. Do not repeat the same statistics in the text and in a table.
| Rule (APA numbers and statistics guide) | Write | Avoid |
|---|---|---|
| Exact p values to two or three decimals | p = .006, p = .03 | p < .05 for every result |
| Values under .001 | p < .001 | p = .000 |
| No leading zero if the statistic cannot exceed 1 | r = .45, p = .028 | r = 0.45 |
| Leading zero if it can exceed 1 | d = 0.74 | d = .74 |
| Means and SDs on integer scales to one decimal; t, F, correlations to two | M = 3.4, t(48) = 2.60 | M = 3.4167 |
| Italics for statistical symbols, not for Greek letters | M, SD, t, F, p, α | M, SD, α |
| The word in running text, the symbol with an operator | “the means were” | “the Ms were” |
JARS-Quant asks for “effect-size estimates and confidence intervals” for each inferential test, “when possible”. Formatting the tables themselves is covered in our guide to APA table format.
Results section example 1: a quantitative study
Okano and colleagues (2019) gave activity trackers to students in an introductory chemistry class at MIT and correlated their sleep with their grades; 88 completed the study. The paper is in npj Science of Learning, published under a Creative Commons Attribution (CC BY 4.0) licence. Quotes are exact, with reference numbers removed.
The results run to about 1,300 words under five subheadings, from bedtimes to gender differences, and move from descriptive statistics and correlations to a regression: the univariate, bivariate, then multivariate order Bahadoran and colleagues describe. In this journal the Methods come after the Discussion, so the 12 exclusions are reported there; in an APA paper they would open the results. Because the design is correlational, the findings describe associations; our guide to why correlation is not causation covers what else can produce them.
A finding reported test-first.
A Pearson’s product-moment correlation between average bedtime and overall score revealed a significant and negative correlation (r (86) = −0.45, p < 0.0001), such that earlier average bedtime was associated with a higher overall score.
The finding arrives in the last clause. Bahadoran and colleagues even object to “revealed”, calling it “a funny word that suggests something was found perhaps by magic.” Our rewrite, finding first and in APA format: “Students who went to bed earlier had higher overall scores, r(86) = −.45, p < .001.” The leading zero goes because a correlation cannot exceed 1, and p < .001 replaces p < 0.0001. JARS-Quant would also ask for a confidence interval.
A null result, reported in full.
There were no significant correlations with sleep duration or sleep quality for all three midterms (all rs < 0.20, all ps > 0.05).
One of the findings the abstract highlights is a non-result: sleep on the night before an exam did not predict the score. It has its own subheading and its statistics, and the discussion’s second paragraph takes it up in its second sentence (“Unlike a prior study, we did not find…”), as shown in our guide on how to write a discussion section.
Three slips worth avoiding. The gender subsection explains as it reports, three times, as in “suggesting that it may be more important for males to get a long-duration sleep in order to get good quality sleep”. That sentence belongs in the discussion. The section also calls quiz correlations with “all ps < 0.08” marginal, close to the “marginally significant” that Bahadoran and colleagues call not acceptable when the significance level is .05. And p values appear in three formats (0.01, < 0.0001, .00003); pick one convention and keep it.
Results section example 2: a qualitative study
Edvardsen Tonheim and colleagues (2025) interviewed 14 health science master’s students about online group work and analysed the transcripts with reflexive thematic analysis. The paper is in BMC Medical Education under CC BY 4.0. Quotes keep the authors’ and participants’ wording, with reference numbers removed.
Opening: the sample, then the themes.
Fourteen students aged 25 to 56 years participated in interviews (Table 1).
A table of participants follows, then one sentence and a diagram: “We developed three themes and eight subthemes (later referred to in bold text) from the analysis (Fig. 1)”. Each theme then gets its own subheading, which the discussion reuses word for word, so a reader can go from a theme’s evidence to its interpretation.
Inside a theme: claim, quotation, interpretation.
Nevertheless, scheduling group meetings was experienced as a major challenge, attributed to the group members’ other commitments in everyday life. This was described by one of the full-time students as follows:
“…. So, then it’s a bit difficult to find a common time when everyone can meet on Zoom…… That’s perhaps kind of the recurring problem, finding time that suits everyone” (S14).
The claim comes first, the quotation proves it, and the participant code shows whose words they are. Across about 2,200 words there are 32 attributed quotations from 13 participant codes, and no code appears more than three times. The next paragraph moves up a level: participation “became a matter of choice and thus a question of priority.” In qualitative work that is expected: JARS-Qual asks findings to describe “the meaning and understandings that the researcher has derived from the data analysis”.
What a stricter reader would change. Cristancho, Watling and Lingard call an opening that lists themes “an inventory of themes”, which is “not wrong” but tells no story; one sentence on how the three themes fit together would do more.
How do you write a qualitative results (findings) section?
Organise a qualitative findings section by theme. Introduce each theme with a sentence that states its claim, support each point with a short quotation, drawing on several participants across the theme, and say after each quotation what it shows. Quotations illustrate the analysis; they do not replace it. JARS-Qual puts it this way: quotes “should not replace the description of the findings of the analysis.”
Cristancho and colleagues give three tests for choosing quotations: they should be “illustrative of the point you’re making about the data, reasonably succinct and representative of the patterns in data”, and should not all “come from the same one or two highly articulate participants.” They also offer a tense check: past tense for what participants said, present tense for your interpretation, and a recommendation means you have crossed into the discussion.
Guides differ on how many quotations to use per point. Southampton’s dissertation guide suggests you “quote two or three relevant examples” per point, while Cristancho and colleagues write that “multiple quotations to support a single point should be avoided” unless each adds a layer. Use one strong quotation per claim and add a second only when it shows something new. The glossary entry on thematic analysis covers how the themes are built.
“Findings” and “results” name the same section: JMU’s overview says “Results (also sometimes called Findings)”. Our comparison of qualitative vs quantitative research explains why the two kinds of evidence read so differently.
Can you combine the results and discussion sections?
Yes, if your journal, department or field allows it. USC’s guide notes that combined sections are not unusual in scholarly journals, and JARS-Qual notes that in qualitative work “findings and discussion may be combined”. Purdue OWL ties it to “the requirements or the projected length of your paper”. If you have the choice and little experience, keep them apart.
That is USC’s advice for anyone “inexperienced writing college-level research papers”. Southampton’s guide gives two ways to combine them: results then discussion within one chapter, or alternating subsets, each reported and then interpreted.
How is a thesis results chapter different?
A thesis or dissertation results chapter does the same job at greater length, usually as its own chapter followed by a separate discussion. Southampton’s guide lists four ways to organise it: chronologically, by research method, by research question or hypothesis, or by variable. Raw data go in an appendix, and citations are rare because the chapter reports your own data.
Victoria University of Wellington’s guide notes that “in-text citations are infrequent or absent” and that the chapter “lays the foundations for your Discussion chapter”. Southampton adds that tables and figures “should not entirely replace your written account of the data”. Check your department’s handbook before you choose a structure.
How long should a results section be?
A journal results section is often about 1,000 words. Bahadoran and colleagues give “2 - 3 pages (~1000 words)” in four to nine paragraphs of about 130 words each. USC’s guide calls it, “aside from the conclusion”, the shortest part of most papers. Qualitative findings run longer, because the quotations are part of the evidence.
JARS-Qual says so directly: “The findings section tends to be longer than in quantitative papers”. The two examples above fit: about 1,300 words for the quantitative study, about 2,200 for the qualitative one.
What are the most common results section mistakes?
Most weak results sections fail in one of three ways: they interpret instead of report, they bury the finding under the name of the test, or they leave out what did not work. The rest are smaller slips, such as the same numbers in a table and in the text, or a p value with no effect size. The table below pairs each mistake with its fix.
| Mistake | What it looks like | Fix |
|---|---|---|
| Interpreting | “suggesting that it may be more important for males…” | Move the explanation to the discussion |
| Test as the subject | “A Pearson correlation revealed…” | Start with the finding, then the statistic |
| Missing null results | Only the significant tests appear | Report every planned analysis |
| Repeating a table | Every cell read out in the text | Give the pattern and one or two key values |
| p values alone | “p < .05” with no effect size | Add the statistic, effect size and confidence interval |
| Comparing with other studies | “in line with Smith (2020)” | Usually save it for the discussion |
The last row is a judgement call. USC’s guide allows comparing “specific results to those found in any prior studies” where appropriate; Bahadoran and colleagues list it among the don’ts. In a student paper, keep comparisons for the discussion.
A results section template
Use these sentence frames for a first draft, then cut whatever your study does not need. They are ours, written for a quantitative study with one qualitative row, in the order of the steps above. Replace each bracket with your own values, and check every number against your statistics output before you submit.
| Part | Sentence frame |
|---|---|
| Sample | Of the [n] people who [enrolled], [n] were included in the analysis; [n] were excluded because [reason]. |
| Descriptives | Table 1 shows the means and standard deviations of [variables] for each group. |
| Group difference | [Group A] scored higher on [outcome] than [group B], t([df]) = [value], p = [value], d = [value], 95% CI [[lower], [upper]]. |
| Association | Higher [variable X] was associated with higher [variable Y], r([df]) = [value], p = [value], 95% CI [[lower], [upper]]. |
| Null result | [Variable X] was not associated with [variable Y], r([df]) = [value], p = [value], 95% CI [[lower], [upper]]. |
| Qualitative theme | [Theme]. [Number or “most”] participants described [claim]: “[quotation]” ([code]). |
| Close | In summary, [main finding], [second finding], and [null finding]. |
A lab report uses the same frames on a smaller scale, as the results in our lab report example show.
Where Papero fits
Papero is an AI writing workspace for students and researchers. Its outline builder can start a paper from a standard IMRaD structure, and the Results heading comes with three prompt lines: “The main findings, in the order of your questions”, “The tables or figures that show them” and “Findings only, no interpretation yet”. Those match steps 1 and 5 above and keep interpretation for the discussion.
Papero does not run or check your analysis, so the numbers and what they show stay yours. When you export to Word in the manuscript layout with APA 7 set, the document follows APA’s heading levels, which suits a results section with subheadings. The research paper writing page shows the whole process, and you can sign up free.
Frequently Asked Questions
What tense should a results section be written in?
Write the results in the past tense, because they report what the study found: “Students who slept longer had higher grades.” Refer to tables and figures in the present tense, as in “Table 2 shows the means.” In qualitative work, use the past tense for what participants said.
What should not go in a results section?
Leave out explanations of why a result happened, comparisons with earlier studies, recommendations, methods details already given in the methods section, and raw data. Explanations and comparisons belong in the discussion, and raw data or full transcripts go in an appendix if your instructor or journal asks for them.
What is the difference between results and findings?
They are two names for the same section. “Results” is more common in quantitative and scientific papers, and “findings” in qualitative research, where the section presents themes supported by quotations. APA’s reporting standards for qualitative research head the section “Findings/Results”.
Can a results section be only tables and figures?
No. Every table and figure needs a sentence that states the main finding it shows and refers to it by number. The text should not read out every value, but a reader should be able to follow the results from the text alone.
How do you start a results section?
Start with the sample: how many people took part, how many were analysed, and why any were excluded. Then give descriptive statistics, usually in Table 1, and move to the analysis that answers your first research question.
Sources
- American Psychological Association. (2024). APA Style numbers and statistics guide [PDF]. https://apastyle.apa.org/instructional-aids/numbers-statistics-guide.pdf
- American Psychological Association. (2024). Journal article reporting standards for quantitative research (JARS-Quant), Table 1: Information recommended for inclusion in manuscripts that report new data collections regardless of research design [PDF]. APA Style. https://apastyle.apa.org/jars/quant-table-1.pdf
- American Psychological Association. (2024). Journal article reporting standards for qualitative research (JARS-Qual), Table 1: Information recommended for inclusion in manuscripts that report primary qualitative research [PDF]. APA Style. https://apastyle.apa.org/jars/qual-table-1.pdf
- Bahadoran, Z., Mirmiran, P., Zadeh-Vakili, A., Hosseinpanah, F., & Ghasemi, A. (2019). The principles of biomedical scientific writing: Results. International Journal of Endocrinology and Metabolism, 17(2), Article e92113. https://doi.org/10.5812/ijem.92113
- Cristancho, S., Watling, C. J., & Lingard, L. A. (2021). Three principles for writing an effective qualitative results section. Focus on Health Professional Education: A Multi-Professional Journal, 22(3), 110–124. https://doi.org/10.11157/fohpe.v22i3.556
- Edvardsen Tonheim, L., Molin, M., Brevik, A., & Garnweidner-Holme, L. (2025). Experiences with online group work among master’s students in health sciences: A qualitative study. BMC Medical Education, 25, Article 1262. Licence: CC BY. https://doi.org/10.1186/s12909-025-07845-w
- James Madison University Writing Center. (n.d.). Results/findings sections for empirical research papers: An overview [PDF]. https://www.jmu.edu/uwc/files/link-library/empirical/findings-results_section_overview.pdf
- Okano, K., Kaczmarzyk, J. R., Dave, N., Gabrieli, J. D. E., & Grossman, J. C. (2019). Sleep quality, duration, and consistency are associated with better academic performance in college students. npj Science of Learning, 4, Article 16. Licence: CC BY. https://doi.org/10.1038/s41539-019-0055-z
- Purdue Online Writing Lab. (n.d.). Writing the experimental report: Methods, results, and discussion. Purdue University. https://owl.purdue.edu/owl/subject_specific_writing/writing_in_the_social_sciences/writing_in_psychology_experimental_report_writing/experimental_reports_2.html
- San José State University Writing Center. (2022). Results section for research papers [PDF]. https://www.sjsu.edu/writingcenter/docs/handouts/Results%20Section%20for%20Research%20Papers.pdf
- Springer Nature. (n.d.). Results. In Writing a manuscript. https://www.springernature.com/gp/authors/campaigns/writing-a-manuscript/results
- Te Herenga Waka Victoria University of Wellington. (n.d.). Writing the results chapter. Te Taiako Student Learning. https://www.wgtn.ac.nz/student-learning/studyhub/postgraduate-students/post-graduate-writing/writing-a-thesis/writing-the-results-chapter
- University of California, Irvine Libraries. (n.d.). Results. In Scientific writing. https://guides.lib.uci.edu/scientificwriting/results
- University of Southampton Library. (n.d.). Results and discussion. In Writing the dissertation: Guides for success. https://library.soton.ac.uk/writing_the_dissertation/results_discussion
- University of Southern California Libraries. (2026). 7. The results. In Organizing your social sciences research paper. https://libguides.usc.edu/writingguide/results