Reliability vs validity is consistency against accuracy: reliability is whether a measure gives consistent results; validity is whether it measures what it claims to measure. A bathroom scale that always reads 2 kg heavy is reliable but not valid. Reliability is a precondition for validity, never proof of it. This guide covers every combination, the main types, published values from real validation studies, and how to report both.
Key Takeaways
- Reliability is about random error: would the same person get the same score again, from another rater or on another item? Validity is about whether the scores mean what you say they mean.
- A measure can be reliable without being valid. It cannot be valid without being reliable: the larger the random part of a score, the less it can track anything, so low reliability caps validity.
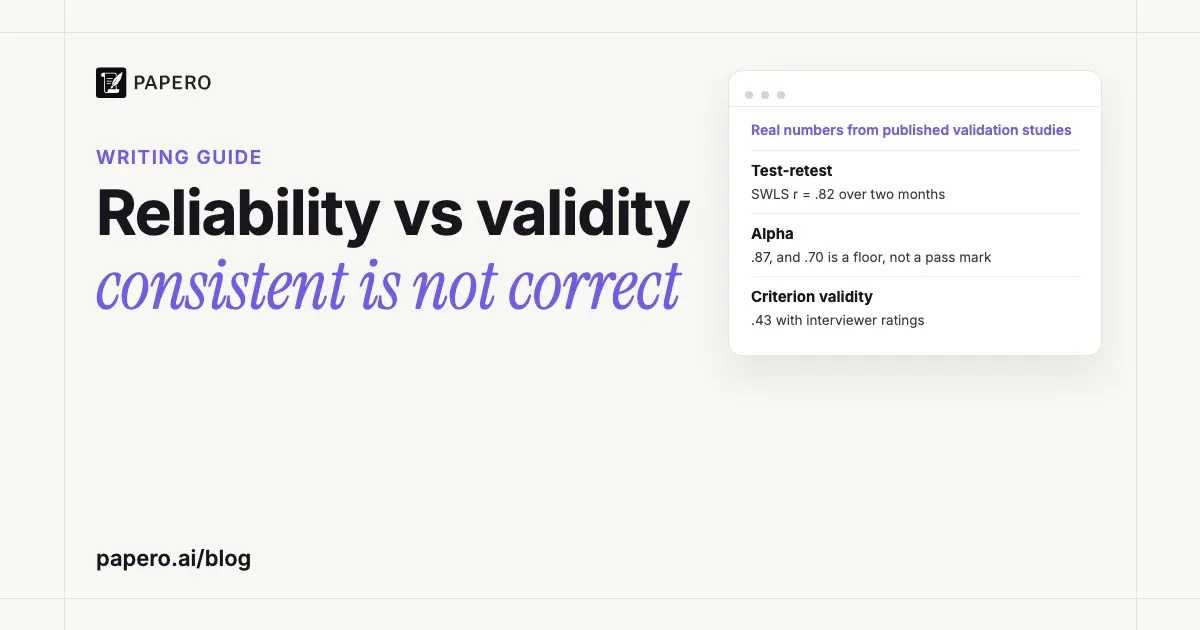
- The Satisfaction With Life Scale shows how both are reported: a two-month test-retest correlation of .82, an alpha of .87, and a .43 correlation between older adults’ scores and interviewers’ ratings of their life satisfaction.
- Benchmarks such as “alpha of .70 or higher” or “a kappa of .61 to .80 is substantial” belong to named authors. Cite the rule you use, and report the number itself.
- Internal and external validity describe a study, not an instrument. Qualitative research usually uses trustworthiness criteria in place of reliability and validity.
What is the difference between reliability and validity?
Reliability is the consistency of a measurement: the same instrument, used again, by another rater or through other items aimed at the same construct, gives similar scores. Validity is the accuracy of the interpretation: the scores reflect the construct you claim to measure and support the use you put them to. Reliability is checked by repeating the measurement; validity is checked against theory and other evidence.
OpenStax’s Psychology 2e defines reliability as “the ability to consistently produce a given result” and validity as “the extent to which a given instrument or tool accurately measures what it’s supposed to measure”. The joint testing standards of the AERA, APA and NCME go further: validity “refers to the degree to which evidence and theory support the interpretations of test scores for proposed uses of tests”, and “It is incorrect to use the unqualified phrase “the validity of the test.”” A depression questionnaire can be valid for screening adults in primary care and unproven for teenagers.
| Reliability | Validity | |
|---|---|---|
| Question it asks | Would I get the same score again? | Does the score mean what I say it means? |
| Error it detects | Random error (noise) | Systematic error, or the wrong construct |
| How it is checked | Repeat the measurement: over time, across raters, across items | Compare with content, theory and other measures |
| Usual statistics | Test-retest r, Cronbach’s alpha, kappa, ICC | Correlations with other measures, sensitivity and specificity |
| Possible without the other? | Yes | No |
Can a measure be reliable but not valid, or valid but not reliable?
Yes to the first, no to the second. A measure that gives the same wrong answer every time is reliable but not valid. A measure whose scores jump around from one occasion to the next cannot be valid, because random noise does not track the construct. Picture each score as a shot at a target whose centre is the true value, and four patterns appear.
| Pattern on the target | Reliable? | Valid? | Example |
|---|---|---|---|
| Shots in a tight group on the centre | Yes | Yes | A well-validated questionnaire used with the population it was built for |
| Shots in a tight group away from the centre | Yes | No | A scale that always reads 2 kg heavy |
| Shots scattered widely around a point away from the centre | No | No | Untrained observers rating a vague behaviour |
| Shots scattered evenly around the centre | No | Not for any single score | A noisy measure whose average happens to be right |
Some diagrams label the last row “valid but not reliable”. The average of many shots lands on the centre, so a noisy measure can still estimate a group mean without bias. Each individual shot still misses, and validity is a claim about what each score means. OpenStax puts it in one sentence: “While any valid measure is by necessity reliable, the reverse is not necessarily true.” The testing standards say the same about prediction: to the extent that scores “reflect random errors of measurement”, their “potential for accurate prediction of criteria, for beneficial examinee diagnosis, and for wise decision making is limited.”
What are the types of reliability and validity?
Reliability has four common types: test-retest (stable over time), inter-rater (raters agree), internal consistency (items agree with each other) and parallel forms (two versions agree). Validity is usually split into content, face, construct and criterion validity, with criterion validity divided into concurrent and predictive. Every number in the last column comes from a published study listed under Sources.
| Type | The question | How it is checked | Published value |
|---|---|---|---|
| Test-retest reliability | Same people, same score later? | Correlate two administrations | SWLS: .82 over two months (76 students) |
| Internal consistency | Do the items measure one thing? | Cronbach’s alpha or omega | SWLS: alpha .87; PHQ-9: .89 and .86 in two samples |
| Inter-rater reliability | Do raters agree? | Kappa for categories, ICC or r for scores | Two SWLS interviewers: r = .73; risk of bias reviewers: kappa .13 to .74 |
| Parallel forms | Do two versions agree? | Correlate scores on version A and B | No published value in this guide |
| Content validity | Does it cover the whole construct? | Expert review of items against a definition | Judged, not computed |
| Face validity | Does it look right to the people taking it? | Ask respondents or stakeholders | Judged, not computed |
| Construct validity | Does it relate to other measures as theory predicts? | Correlations with similar and unrelated measures | SWLS: .54 with self-esteem, .02 with social desirability |
| Concurrent criterion validity | Does it match a criterion measured now? | Compare with an accepted standard | PHQ-9 score of 10 or more: 88% sensitivity and 88% specificity against a clinician interview |
| Predictive criterion validity | Does it predict a later outcome? | Correlate with the outcome measured later | SAT and first-year college GPA: r = .35 raw, .53 adjusted |
The glossary entry on reliability in research has short definitions of each reliability type and the common threats to it.
One scale, six numbers. The Satisfaction With Life Scale (SWLS) by Diener, Emmons, Larsen and Griffin (1985) is five statements rated from 1 to 7. With 176 undergraduates, 76 of whom took the scale again two months later, “The two-month test-retest correlation coefficient was .82, and coefficient alpha was .87.” In a second sample of 163 students, SWLS scores correlated .54 with self-esteem and only .02 with a social desirability scale, “indicating that the SWLS is not evoking a social desirability response set”: a pair that reads as convergent and discriminant evidence for construct validity, although the authors wrote that “Future research needs to establish the discriminant validity of the scale.” In a third study, two interviewers spent about an hour with each of 53 older adults and rated their life satisfaction. The two interviewers’ ratings “correlated .73”, which is inter-rater reliability, and their combined rating “correlated .43 with the SWLS”, which the authors call a criterion validity coefficient.
Concurrent and predictive validity. Kroenke, Spitzer and Williams (2001) checked the nine-item PHQ-9 depression questionnaire against interviews by mental health professionals with 580 patients: “a PHQ-9 score ≥10 had a sensitivity of 88% and a specificity of 88% for major depression.” Interview and questionnaire came within 48 hours of each other, so this is concurrent evidence. Predictive evidence needs an outcome measured later. A College Board study of 151,316 students correlated SAT scores with first-year college GPA: 0.35 raw, 0.53 after correcting for the restricted range of admitted students (Kobrin et al., 2008). High school GPA did slightly better on its own (0.36 raw, 0.54 adjusted), and the two together did best.
The testing standards disagree with the table. The 2014 Standards for Educational and Psychological Testing treat the validity rows as sources of evidence, not separate kinds of validity: they “do not represent distinct types of validity. Validity is a unitary concept.” Their five sources are test content, response processes, internal structure, relations to other variables, and consequences of testing, and the edition deliberately avoids “historical nomenclature (i.e., the use of the terms content validity or predictive validity)”. Textbooks still use the older names, so use them where your marker expects them, and say what evidence supports your interpretation of the scores.
Is internal validity the same as the validity of a measure?
No. Internal and external validity describe a study; construct, content and criterion validity describe a measure. Internal validity asks whether the design supports the causal conclusion, external validity whether the results generalise beyond the sample. A study can use a well-validated questionnaire and still have weak internal validity, for example when groups were not randomly assigned and differed from the start.
Lists of validity types often put internal and external validity next to construct validity, which mixes the two levels. Andrade (2018) keeps them apart: “Reliability and validity describe desirable psychometric characteristics of research instruments. The concept of validity is also applied to research studies and their findings.” Internal validity “examines whether the study design, conduct, and analysis answer the research questions without bias”, and external validity “examines whether the study findings can be generalized to other contexts”. The validity glossary entry lists the classic threats to internal validity, such as selection and attrition.
The two levels meet in systematic reviews. The Cochrane risk of bias tool judges the internal validity of trials, yet it is also a rating instrument with reliability of its own. When Hartling et al. (2009) had pairs of reviewers, drawn from a team of five, apply it to 163 trials, weighted kappa ranged from 0.13 for selective reporting to 0.74 for sequence generation, and was 0.27 for the overall judgement; “agreement was poorer for those items that required more judgment.” A tool that rates validity is only as useful as the agreement between the people using it.
What counts as good reliability and validity? Benchmarks and whose rule they are
There is no universal cut-off. The figures students quote are rules of thumb from particular authors: Landis and Koch’s labels for kappa, Cicchetti’s for the intraclass correlation, and Nunnally’s .70 for alpha in early-stage research. Each depends on the purpose, and the testing standards ask for more precision when a score drives a decision that is hard to reverse. Validity coefficients have no general labels at all.
Kappa. Landis and Koch (1977) proposed labels for agreement beyond chance. As Hallgren’s (2012) tutorial summarises them, 0.0 to 0.20 is slight, 0.21 to 0.40 fair, 0.41 to 0.60 moderate, 0.61 to 0.80 substantial, and 0.81 to 1.0 almost perfect. Hartling et al. categorised their kappas with these bands. Others are stricter: McHugh (2012), who credits the same bands to Cohen, argues that they may be “too lenient for health related studies” and calls 0.60 to 0.79 only moderate. The DSM-5 field trials used yet another scale, calling 0.40 to 0.59 “good” and 0.60 to 0.79 “very good” (Regier et al., 2013). The same kappa can be moderate in one paper and good in another, so report the value and name the scale. If you know these labels only from a summary such as Hallgren’s tutorial, APA has you cite them “as cited in” that summary; our guide to primary vs secondary sources shows the form in APA and MLA.
Intraclass correlation. For ratings on a continuous scale, Hallgren cites Cicchetti (1994): below .40 is poor, .40 to .59 fair, .60 to .74 good, and .75 to 1.0 excellent.
Cronbach’s alpha. The .70 rule traces to Nunnally. In the 1994 edition of Psychometric Theory, Nunnally and Bernstein wrote that in “the early stages of research”, “reliabilities of .70 or higher will suffice”, and added: “In contrast to the standards in basic research, in many applied settings a reliability of .80 is not nearly high enough.” So .70 was a floor for exploratory work, not a pass mark for every questionnaire. Tavakol and Dennick (2011) note that reported acceptable values range “from 0.70 to 0.95” and that “A maximum alpha value of 0.90 has been recommended”, since a very high alpha may mean redundant items. Alpha also rises with the number of items, so a long scale can reach .90 without measuring one clear thing.
Validity coefficients. Validity coefficients have no general-purpose labels; the few label schemes that exist are tied to one use, such as hiring tests. A raw .35 between a test and grades earned a year later, as in the SAT study, is a different result from .35 between two questionnaires that claim to measure the same construct, which would raise doubts about one of them. Judge a validity coefficient against the purpose and against what other measures achieve. When a coefficient has been corrected, Standard 1.21 asks for “both adjusted and unadjusted coefficients”, as the SAT study did.
How do you write about reliability and validity in a methods section?
For each instrument, give its name and source, the published reliability and validity evidence with numbers and the population it came from, and the reliability in your own sample. For anything coded or rated by people, report how agreement was checked, the statistic, and the benchmark you used. If you translated or shortened an instrument, say what you checked again afterwards.
The paragraph below was written for this guide. The SWLS figures come from Diener et al. (1985); the figures for “the present sample” and the coding check are invented to show the format.
Life satisfaction was measured with the Satisfaction With Life Scale (SWLS; Diener et al., 1985), five statements rated from 1 (strongly disagree) to 7 (strongly agree) and summed (range 5 to 35). In the original validation, the scale showed a two-month test-retest correlation of .82 and a coefficient alpha of .87 among undergraduates, and scores correlated .43 with interviewers’ ratings of life satisfaction among older adults. In the present sample, Cronbach’s alpha was .84. Answers to the open question on sources of satisfaction were coded by the first author; a second coder independently coded a random 20% of responses (n = 62), with agreement of κ = .71, substantial by Landis and Koch’s (1977) labels. Disagreements were resolved by discussion before the remaining responses were coded.
The second sentence names the population the borrowed evidence came from, because reliability belongs to scores in a sample, not to the questionnaire forever; the third shows the scale held up in your data. Our guide on how to write a methodology section shows where this paragraph sits among the other parts, with a published SWLS example. Anything that falls short, such as a low alpha in your sample or a scale validated only in another country, belongs among the limitations of your study.
A thesis also defends the design in terms of internal and external validity: why the comparison is fair, and who the results apply to. How the independent and dependent variables were defined and measured is part of that argument.
What replaces reliability and validity in qualitative research?
Qualitative research is usually judged on trustworthiness, the criteria Lincoln and Guba proposed: credibility, transferability, dependability and confirmability. Credibility parallels internal validity, transferability generalisability, dependability reliability, and confirmability objectivity, but the checks differ: an audit trail and member checking take the place of correlations and alpha.
Korstjens and Moser (2018) state that quantitative criteria, “e.g. internal validity, generalizability, reliability, and objectivity, are not suitable to judge the quality of qualitative research.” In their account, credibility “is the equivalent of internal validity in quantitative research”, “Dependability includes the aspect of consistency”, and “Confirmability concerns the aspect of neutrality”. An audit trail, a full record of decisions from sampling to analysis, supports both dependability and confirmability. Our comparison of qualitative vs quantitative research lists these criteria and where they go in a thesis methodology chapter, alongside sampling and saturation.
Where Papero fits
Papero is an AI writing workspace for students and researchers. When you describe a research paper, its outline builder can start from a standard IMRaD structure with a prompt for each section; the Methods prompt asks for “Design, participants or materials”, “Procedure and measures” and “How the data were analysed”, which is where instruments and their reliability go. Find papers searches more than 250 million papers through OpenAlex, which helps when you need the original validation study for a scale. Review’s Claims check finds sentences that need a citation, such as a borrowed alpha value with no source.
The research paper writing page walks through the process from outline to Word export. Choosing instruments and judging whether their evidence fits your sample stay your job.
Frequently Asked Questions
Can a test be reliable but not valid?
Yes. A test is reliable but not valid when it gives consistent scores that measure the wrong thing or are biased in one direction. A bathroom scale that always reads 2 kg heavy is the classic example. A questionnaire that consistently picks up a wish to look good, instead of the trait it names, is another.
Can a test be valid but not reliable?
Not for individual scores. If scores change randomly from one occasion or rater to the next, no single score can be trusted to reflect the construct, so the measure cannot be valid. A noisy measure can still give an unbiased average over many people, which is why some diagrams show a “valid but not reliable” target.
Which is more important, reliability or validity?
Validity is the goal, because it decides whether the scores mean anything for your purpose. Reliability comes first in practice, because a measure has to be consistent before it can be valid. Report evidence for both: a high alpha alone says nothing about whether the scale measures the right construct.
What is a good Cronbach’s alpha?
Nunnally and Bernstein suggested .70 or higher for early-stage research and wrote that in many applied settings even .80 is not nearly high enough. Values above about .90 can signal redundant items. Alpha rises with the number of items, so report it with the scale length and cite the rule of thumb you apply.
What is the difference between reliability and validity in psychology?
In psychology, reliability means a test or scale gives consistent scores over time, across raters and across its items. Validity means the scores reflect the psychological construct the test claims to measure, such as depression or life satisfaction, and support the decisions made with them.
Sources
- American Educational Research Association, American Psychological Association, & National Council on Measurement in Education. (2014). Standards for educational and psychological testing. American Educational Research Association. Chapter 1, Validity (pp. 11–19, 29) and Chapter 2, Reliability/precision and errors of measurement (pp. 33–35). Open access: https://www.testingstandards.net/open-access-files.html
- Andrade, C. (2018). Internal, external, and ecological validity in research design, conduct, and evaluation. Indian Journal of Psychological Medicine, 40(5), 498–499. https://doi.org/10.4103/IJPSYM.IJPSYM_334_18
- Diener, E., Emmons, R. A., Larsen, R. J., & Griffin, S. (1985). The Satisfaction With Life Scale. Journal of Personality Assessment, 49(1), 71–75. https://doi.org/10.1207/s15327752jpa4901_13
- Hallgren, K. A. (2012). Computing inter-rater reliability for observational data: An overview and tutorial. Tutorials in Quantitative Methods for Psychology, 8(1), 23–34. https://doi.org/10.20982/tqmp.08.1.p023
- Hartling, L., Ospina, M., Liang, Y., Dryden, D. M., Hooton, N., Krebs Seida, J., & Klassen, T. P. (2009). Risk of bias versus quality assessment of randomised controlled trials: Cross sectional study. BMJ, 339, Article b4012. https://doi.org/10.1136/bmj.b4012
- Kobrin, J. L., Patterson, B. F., Shaw, E. J., Mattern, K. D., & Barbuti, S. M. (2008). Validity of the SAT for predicting first-year college grade point average (Research Report No. 2008-5). College Board. ERIC ED563202. https://files.eric.ed.gov/fulltext/ED563202.pdf
- Konstabel, K., Lönnqvist, J.-E., Leikas, S., García Velázquez, R., Qin, H., Verkasalo, M., & Walkowitz, G. (2017). Measuring single constructs by single items: Constructing an even shorter version of the “Short Five” personality inventory. PLOS ONE, 12(8), Article e0182714. Source of the Nunnally and Bernstein (1994, p. 265) quotation. https://doi.org/10.1371/journal.pone.0182714
- Korstjens, I., & Moser, A. (2018). Series: Practical guidance to qualitative research. Part 4: Trustworthiness and publishing. European Journal of General Practice, 24(1), 120–124. https://doi.org/10.1080/13814788.2017.1375092
- Kroenke, K., Spitzer, R. L., & Williams, J. B. W. (2001). The PHQ-9: Validity of a brief depression severity measure. Journal of General Internal Medicine, 16(9), 606–613. https://doi.org/10.1046/j.1525-1497.2001.016009606.x
- Landis, J. R., & Koch, G. G. (1977). The measurement of observer agreement for categorical data. Biometrics, 33(1), 159–174. https://doi.org/10.2307/2529310
- McHugh, M. L. (2012). Interrater reliability: The kappa statistic. Biochemia Medica, 22(3), 276–282. https://doi.org/10.11613/BM.2012.031
- Regier, D. A., Narrow, W. E., Clarke, D. E., Kraemer, H. C., Kuramoto, S. J., Kuhl, E. A., & Kupfer, D. J. (2013). DSM-5 field trials in the United States and Canada, Part II: Test-retest reliability of selected categorical diagnoses. American Journal of Psychiatry, 170(1), 59–70. https://doi.org/10.1176/appi.ajp.2012.12070999
- Spielman, R. M., Jenkins, W. J., & Lovett, M. D. (2020). Psychology 2e, Section 2.3, Analyzing findings. OpenStax. https://openstax.org/books/psychology-2e/pages/2-3-analyzing-findings
- Tavakol, M., & Dennick, R. (2011). Making sense of Cronbach’s alpha. International Journal of Medical Education, 2, 53–55. https://doi.org/10.5116/ijme.4dfb.8dfd