A confounding variable is a third factor that is linked to both the independent variable and the outcome, so it offers another explanation for the result. If coffee drinkers get lung cancer more often, smoking may be the reason: smokers drink more coffee, and smoking causes lung cancer. This guide shows two published studies where a confounder reversed the finding, and the five standard ways to control one.
Key Takeaways
- A confounder has three features: it is associated with the exposure, it predicts the outcome even without the exposure, and it is not a step on the path from exposure to outcome.
- Confounding can create an effect that is not there or reverse its direction. In a 1986 kidney-stone study, open surgery did better for small and for large stones but worse overall.
- Control it in the design (random assignment, restriction, matching) or in the analysis (stratification, multivariable models). Only random assignment also deals with confounders nobody measured.
- A rule of thumb: if adjusting for a factor changes the estimate by about 10% or more, treat that factor as a confounder.
- A mediator is not a confounder. Cholesterol sits on the path from diet to heart disease, so adjusting for it removes part of the effect you want to measure.
What is a confounding variable?
A confounding variable is a factor, other than the one you are studying, that differs between the groups you compare and also affects the outcome. Because it moves with the independent variable, its effect gets mixed into the result. Skelly, Dettori and Brodt describe confounding as a “mixing of effects” that distorts the true relationship between an exposure and an outcome.
For a factor to confound a result, three things have to be true:
- It is associated with the exposure or independent variable. Smokers drink more coffee than non-smokers.
- It predicts the outcome even in the absence of the exposure. Smoking causes lung cancer in people who never drink coffee.
- It is not an intermediate step between exposure and outcome. Smoking is not caused by coffee.
The psychology textbook Research Methods in Psychology gives the experimental version of the same idea: a confounding variable is “an extraneous variable that differs on average across levels of the independent variable”. Its example is a hypothetical study where people in a positive mood remember more than people in a negative mood. If the positive-mood group also has higher IQs on average, nobody can tell whether mood or IQ produced the difference.
Our guide to independent and dependent variables covers the two variables a confounder sits between, and the glossary entry on variables in research lists the other types.
Confounding variable examples
Smoking confounds the link between coffee and lung cancer, age the link between children’s shoe size and reading scores, and family income the link between private tutoring and exam grades. In each case a third factor differs between the groups and also drives the outcome. The first four rows below were written for this article; the last two come from published sources, the mood study above and the kidney-stone study in the next section.
| Apparent cause | Outcome | Confounder | Why it confounds |
|---|---|---|---|
| Drinking coffee | Lung cancer | Smoking | Smokers drink more coffee, and smoking causes lung cancer |
| Shoe size in children | Reading score | Age | Older children have bigger feet and read better |
| Hours of private tutoring | Exam grade | Family income | Richer families buy more tutoring and have other advantages |
| Carrying a lighter | Heart disease | Smoking | People who smoke carry lighters |
| Positive vs negative mood | Memory score | IQ | A textbook example: if one group has higher IQs, either factor could explain the result |
| Type of kidney surgery | Stone removed | Stone size | Surgeons chose the treatment partly by stone size, and small stones are easier to remove |
The pattern is always the same: something that already differs between the groups also pushes the outcome. Swap the apparent cause for the confounder in your head, and the result still makes sense, which is the warning sign. Confounding is one of four reasons a correlation can appear when the apparent cause does not drive the outcome.
A real example: kidney stones and Simpson’s paradox
In 1986, Charig and colleagues compared open surgery with percutaneous nephrolithotomy (PCNL), a keyhole procedure, for removing kidney stones. Counting all 700 patients in the two groups, PCNL looked better. Split by stone size, open surgery did better for both small and large stones. Stone size was the confounder, and the reversal is known as Simpson’s paradox. The table uses the counts from Charig’s Tables I and II as reproduced by Nickerson and Brown.
| Stone size | Open surgery | PCNL |
|---|---|---|
| Small stones | 81 of 87 removed (93%) | 234 of 270 removed (87%) |
| Large stones | 192 of 263 removed (73%) | 55 of 80 removed (69%) |
| All patients | 273 of 350 removed (78%) | 289 of 350 removed (83%) |
The two groups were not alike. Three quarters of the open-surgery patients had large stones (263 of 350), while three quarters of the PCNL patients had small ones (270 of 350). Small stones were removed far more often whichever treatment was used, 88% against 72%. So the overall comparison mostly measured who got which stones. Wang and Rousseau point out that surgeons did not assign the treatments at random; the choice was influenced by the size of the stone.
Skelly and colleagues call this pattern confounding by indication: the reason a patient receives a treatment is itself linked to the outcome. It is common wherever doctors, teachers or managers choose who gets an intervention.
When confounding reverses a finding: hormone therapy
For decades, observational studies suggested that postmenopausal hormone therapy protected women against heart disease. A 2002 meta-analysis by Humphrey, Chan and Sox found a summary relative risk of 0.87 for coronary disease with any hormone use, which points toward lower risk. Restricted to studies that adjusted for socioeconomic status and the other major risk factors, the relative risk was 1.07, which points the other way. The authors wrote that the pattern suggested “confounding by these factors”.
The same year, the Women’s Health Initiative trial, which randomly assigned 16,608 women aged 50 to 79 to estrogen plus progestin or a placebo, reported a hazard ratio of 1.29 for coronary heart disease (nominal 95% confidence interval 1.02 to 1.63). Its authors concluded that the regimen should not be started or continued to prevent heart disease. Humphrey and colleagues drew the methodological lesson: a valid answer “will best come from randomized, controlled trials”.
Observational research still has its uses, and both summary estimates had wide intervals that included 1. What settled the question was the randomized trial. Our cohort study guide shows how that kind of observational design measures risk, and where confounding gets in.
How do you identify a confounding variable?
Identify a potential confounder before you collect data, from what is already known about the outcome. List everything that causes or predicts the outcome, then ask of each item whether it is likely to differ between your groups and whether it could be a result of the exposure. A factor that predicts the outcome, is likely to differ between your groups and is not a result of the exposure is a candidate confounder.
After data collection, two checks help. First, compare the groups on each candidate at baseline; a large difference is a warning. Second, compare the crude estimate with one adjusted for the candidate. Skelly and colleagues suggest that if the adjusted estimate differs from the crude one by about 10% or more, the factor should be treated as a confounder and the adjusted estimate used. Pourhoseingholi and colleagues make the same point for stratified data: when the crude and adjusted results differ, confounding is likely.
Measure what you can. Skelly and colleagues note that patient characteristics are often underreported, and an unmeasured factor cannot be adjusted for later.
How to control confounding variables
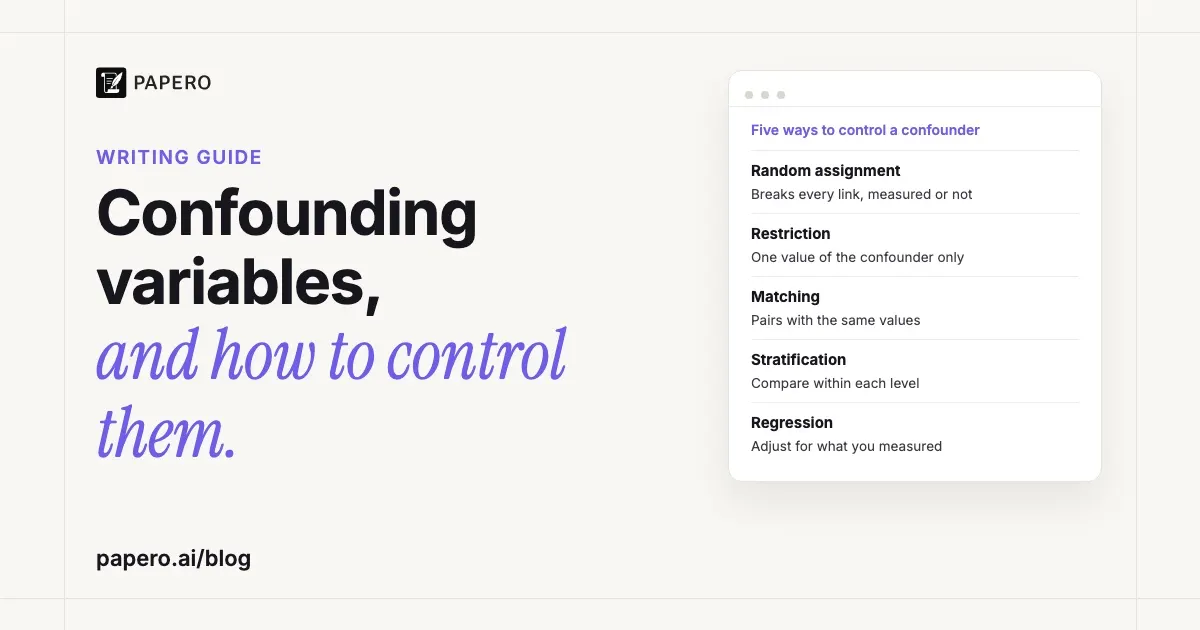
Control confounding in the design with random assignment, restriction or matching, or in the analysis with stratification or multivariable models. Design methods stop the confounder from differing between groups; analysis methods compare like with like after the fact. Pourhoseingholi, Baghestani and Vahedi describe all five.
| Method | Stage | What it does | Example | Limit |
|---|---|---|---|---|
| Random assignment | Design | Breaks the link between the exposure and every confounder, measured or not | A trial assigns drug or placebo by chance | Not possible for exposures you cannot assign, such as smoking |
| Restriction | Design | Enrols only people with one value of the confounder | A study of men aged 40 to 50 cannot be confounded by sex | Results apply only to that group |
| Matching | Design | Pairs each case with a comparison person who has the same confounder values | Each 45-year-old male case gets a 45-year-old male control | Hard to match on many factors at once |
| Stratification | Analysis | Estimates the effect separately within levels of the confounder, then combines them (Mantel-Haenszel) | The kidney-stone table above, split by stone size | Few strata before groups become too small |
| Multivariable models | Analysis | Adjusts for several confounders at once in a regression model | Logistic regression of heart disease on hormone use, age, income and smoking | Only adjusts for what was measured |
Random assignment is the only method that also handles confounders you did not think of, which is why trials sit above observational studies for questions of cause. Even with adjustment, Skelly and colleagues warn, “there will be residual confounding, possibly by factors that are unknown and cannot be measured.” Our guide to types of research methodology compares experimental and observational designs.
Confounding vs extraneous, lurking and mediating variables
These four terms overlap, and textbooks draw the lines slightly differently. A confounder has to be linked to both the independent variable and the outcome and be part of the study; a lurking variable is the same kind of factor left out of it. An extraneous variable is any other factor in the study, and a mediator is part of the effect itself.
| Term | Definition | Example | Adjust for it? |
|---|---|---|---|
| Extraneous variable | Anything that varies in a study other than the independent and dependent variables | Participants’ writing ability in a study of expressive writing | Hold it constant or randomise |
| Confounding variable | An extraneous variable that differs across levels of the independent variable and affects the outcome | IQ, if the positive-mood group scores higher | Yes |
| Lurking variable | A variable related to both study variables that was not considered in the study | When homework was handed in, in a study of homework and quiz scores | Measure it; if it changes the relationship, treat it as a confounder and adjust for it |
| Mediator | A step on the causal path from exposure to outcome | Cholesterol, between diet and heart disease | No: it removes part of the effect |
The extraneous definition is from Research Methods in Psychology. The lurking variable definition and its homework example come from Penn State’s STAT 500 course notes, which add that a lurking variable, “if included in the study, could have a confounding effect and then be classified as a confounding variable.” The mediator example is Skelly and colleagues’: cholesterol is not a confounder because it may be the causal link between diet and coronary heart disease.
How to write about confounding in a paper
Confounding belongs in three parts of a research paper. In the methods section, name the confounders you planned for and how you controlled them. In the results, report crude and adjusted estimates side by side, so readers can see what adjustment changed. In the discussion, name the confounders you could not measure and say which way they would push the result.
A limitations sentence written for this article shows the shape: “Because participants chose whether to join the tutoring programme, students with more motivation may have enrolled more often; we adjusted for prior grades, but motivation itself was not measured, so the effect may be overstated.” It names the factor, says why it could confound, says what was done, and states the likely direction of bias. Our guides to writing the limitations of a study and the methodology section show where each part goes.
Where Papero fits
Papero is an AI writing workspace for students and researchers. It builds an outline for a research paper with a prompt for each section, finds real papers to cite for the sentence you are writing, and formats citations in APA 7 and eight other styles. Among the Review checks, Claims finds sentences that need a citation and offers papers to cite, and Peer review gives an AI reviewer’s report with strengths, weaknesses and questions.
Which confounders matter in your study depends on your design and your field, so you decide them. Papero helps you find and cite the studies that name the usual confounders for your outcome. The glossary entries on control groups and experimental design cover the design side, the research paper writing page shows the whole workflow, and you can sign up free.
Frequently Asked Questions
What is a confounding variable in simple terms?
A confounding variable is a third factor that affects both the thing you think is the cause and the outcome, so it can make two things look related when they are not. Coffee drinking and lung cancer appear linked because smokers drink more coffee. Smoking is the confounder: it explains the link.
What is an example of a confounding variable in psychology?
A textbook example from Research Methods in Psychology: in a hypothetical study, people in a positive mood remember more than people in a negative mood, and the positive-mood group happens to have higher IQs on average. IQ is then a confounder, because it differs between the conditions and could explain the memory scores. Random assignment to mood conditions would prevent that imbalance.
Does random assignment eliminate confounding variables?
Random assignment breaks the link between the treatment and every confounder, measured or not, because chance alone decides who gets which condition. In a small sample, chance can still leave the groups unbalanced, so researchers compare the groups at baseline. Random assignment is impossible for many exposures, such as smoking or income, which is why observational studies rely on restriction, matching and statistical adjustment.
What is the difference between a confounding variable and a lurking variable?
A lurking variable is related to both study variables but was not included in the study, so it cannot be adjusted for. A confounder is one that is in the study and affects the relationship between the variables. Penn State’s statistics notes put it this way: a lurking variable, once included in a study, can be classified as a confounding variable.
Is a confounding variable the same as a control variable?
No. A confounder is a problem: a factor that differs between groups and could explain the result. A control variable is the solution applied to it: a factor the researcher keeps the same for everyone, or measures and adjusts for, so that it cannot explain the result. A confounder that is controlled becomes a control variable.
Sources
- Skelly, A. C., Dettori, J. R., & Brodt, E. D. (2012). Assessing bias: The importance of considering confounding. Evidence-Based Spine-Care Journal, 3(1), 9–12. https://doi.org/10.1055/s-0031-1298595
- Pourhoseingholi, M. A., Baghestani, A. R., & Vahedi, M. (2012). How to control confounding effects by statistical analysis. Gastroenterology and Hepatology From Bed to Bench, 5(2), 79–83. https://pmc.ncbi.nlm.nih.gov/articles/PMC4017459/
- Price, P. C., Jhangiani, R., & Chiang, I.-C. A. (2015). Experiment basics. In Research methods in psychology (2nd Canadian ed.). BCcampus (opentextbc.ca, Wayback Machine capture of June 1, 2026): https://opentextbc.ca/researchmethods/chapter/experiment-basics/
- Charig, C. R., Webb, D. R., Payne, S. R., & Wickham, J. E. (1986). Comparison of treatment of renal calculi by open surgery, percutaneous nephrolithotomy, and extracorporeal shockwave lithotripsy. British Medical Journal (Clinical Research Edition), 292(6524), 879–882. https://doi.org/10.1136/bmj.292.6524.879
- Nickerson, C. A., & Brown, N. J. L. (2019). Simpson’s Paradox is suppression, but Lord’s Paradox is neither: Clarification of and correction to Tu, Gunnell, and Gilthorpe (2008). Emerging Themes in Epidemiology, 16, Article 5. https://doi.org/10.1186/s12982-019-0087-0
- Wang, Z., & Rousseau, R. (2021). COVID-19, the Yule-Simpson paradox and research evaluation. Scientometrics, 126(4), 3501–3511. https://doi.org/10.1007/s11192-020-03830-w
- Humphrey, L. L., Chan, B. K., & Sox, H. C. (2002). Postmenopausal hormone replacement therapy and the primary prevention of cardiovascular disease. Annals of Internal Medicine, 137(4), 273–284. https://doi.org/10.7326/0003-4819-137-4-200208200-00012
- Writing Group for the Women’s Health Initiative Investigators (Rossouw, J. E., et al.). (2002). Risks and benefits of estrogen plus progestin in healthy postmenopausal women: Principal results from the Women’s Health Initiative randomized controlled trial. JAMA, 288(3), 321–333. https://doi.org/10.1001/jama.288.3.321
- Penn State Eberly College of Science. “1.1.4 - Variables.” STAT 500: Applied Statistics (online.stat.psu.edu, Wayback Machine capture of July 8, 2025): https://online.stat.psu.edu/stat500/book/export/html/528