Qualitative vs quantitative research comes down to words against numbers. Qualitative research collects interviews, observations and documents to explain how and why something happens; quantitative research collects numbers to measure how much, how often or how strongly. Below, two pairs of published studies take the same topic both ways, and a fifth study combines them.
Key Takeaways
- In qualitative vs quantitative research, the research question decides the approach. “How do students experience” points to interviews; “what share of students” or “which factors predict” points to a questionnaire and statistics.
- Qualitative studies sample a few information-rich people and give a reason for the number, most often saturation: the point where new data repeat what is known. Quantitative studies fix the sample size in advance and aim to generalise.
- Quantitative work is judged on reliability and validity. Qualitative work is judged on trustworthiness: credibility, transferability, dependability and confirmability.
- “Qualitative data” in a statistics course means categories, such as yes/no answers. A survey of categories is still a quantitative study.
- In a thesis, the methodology chapter has to justify the choice, describe sampling in the matching language, and name the quality criteria and reporting checklist that fit.
What is the difference between qualitative and quantitative research?
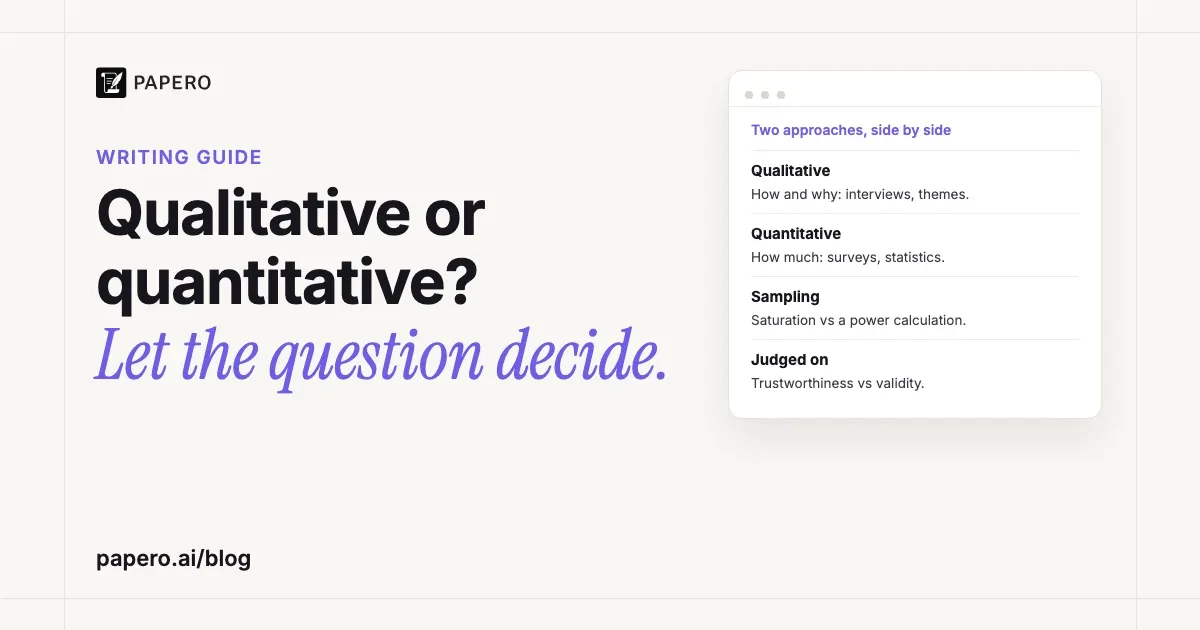
Qualitative research asks how people experience or explain something and answers with themes built from interviews, focus groups, observation or documents. Quantitative research asks how much, how many or what predicts what, and answers with numbers analysed statistically. One builds understanding from a small purposeful sample; the other measures a larger sample so the result can be generalised.
StatPearls, a reference on the National Library of Medicine’s Bookshelf, sums up the qualitative side as answering “the hows and whys instead of how many or how much”, and describes quantitative research as valuing “causality, generalizability, and replicability”. The table compares qualitative vs quantitative research row by row.
| Qualitative research | Quantitative research | |
|---|---|---|
| Aim | Explore and explain experiences, meanings, processes | Measure, compare, test relationships or effects |
| Question wording | How, why, what is it like, in what ways | How much, how many, is there a difference, does X predict Y |
| Sampling | Purposive: people chosen for rich information | Random or defined population, aiming at representativeness |
| Sample size language | “Until saturation”, or another stated rationale | Set beforehand: a power calculation, or a whole population invited |
| Data | Transcripts, field notes, documents, images | Scores, counts, measurements, closed survey answers |
| Analysis | Coding and themes (thematic or content analysis) | Descriptive and inferential statistics |
| Quality criteria | Trustworthiness (Lincoln and Guba), reflexivity | Reliability and validity |
| How results read | Themes with quotations, interpreted as they are presented | Numbers, tables, test statistics; interpretation saved for the discussion |
| Reporting checklist | SRQR or COREQ | STROBE, CONSORT or CHERRIES, depending on design |
The sections below unpack the sampling, quality, reporting and results rows with sources. The glossary entries on qualitative research and quantitative research give short definitions and the main subtypes of each.
Qualitative and quantitative research examples on the same topic
The clearest way to see the difference is one topic studied both ways. The four studies below form two pairs: older adults in the first COVID-19 lockdown, and medical students moved to online teaching. All are open access under a CC BY licence, and every quotation comes from the published article.
| Study | Approach | Participants and data | What came out |
|---|---|---|---|
| Bloom et al. (2022) | Qualitative | 12 people over 80, 35 telephone interviews | Five themes |
| Bevilacqua et al. (2022) | Quantitative | 125 people (median age 84.3), telephone questionnaire | 47% less physically active |
| Khalil et al. (2020) | Qualitative | 60 medical students, eight online focus groups | Four themes |
| Çakmakkaya et al. (2024) | Quantitative | 1,600 students invited, 1,050 responded | Six predictors of satisfaction |
Pair 1: older adults in the first lockdown
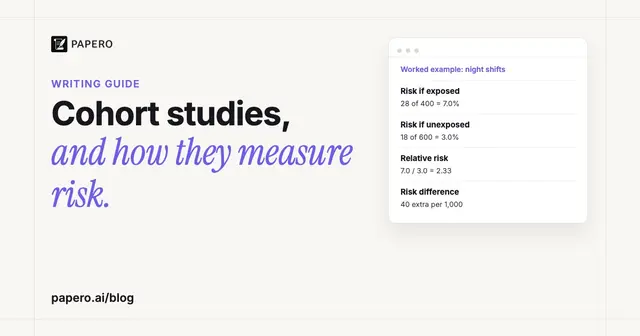
Both papers drew participants from the Hertfordshire Cohort Study in England, both cover the first wave of the pandemic, and six authors appear on both. The population and the team are shared; the approach is not. Our guide to the cohort study explains how researchers follow a group like this one over time and compare risks.
The qualitative study. Bloom et al. (2022) set out “to explore how community-living older people in the UK experienced the first wave of the COVID-19 pandemic, specifically how it impacted their well-being and associated health behaviours”. They phoned the same people two or three times between March and October 2020, transcribed the calls and analysed them thematically: “Data for twelve participants (7 men and 5 women) from a total of 35 interviews were used”, yielding five themes, among them “limitations on activities and going out”. The evidence is quotation, such as a man who missed his gym programme saying “I am neglecting the muscle side I have to say and that’s a bit of a concern”.
The quantitative study. Bevilacqua et al. (2022) aimed “to use two existing cohorts, the Hertfordshire Cohort Study (HCS) and Health and Employment After Fifty Study (HEAF), to understand how wave one of the COVID-19 pandemic impacted lifestyle factors associated with musculoskeletal health in the UK.” A trained researcher read one closed question to 125 Hertfordshire participants by telephone: “Compared to before the lockdown began, during the lockdown period: […] How physically active were you?”, with the answers “Less than usual”, “About the same” or “More than usual”. The finding is a proportion: “In HCS, 47% respondents reported being less physically active than before the pandemic (and only 5% more so).”
What the pair shows. The quantitative paper tells you how many people became less active. The qualitative paper tells you what that looked like: classes and walking groups people could no longer attend, different readings of whether the guidance meant they should stay in, and the coping strategies they found. Twelve participants cannot give you 47%, and a three-option question cannot tell you why someone stopped walking with a group.
Pair 2: medical students and online learning
The qualitative study. Khalil et al. (2020) aimed “to explore undergraduate medical students’ perceptions regarding the effectiveness of synchronized online learning at Unaizah College of Medicine and Medical Sciences, Qassim University, Saudi Arabia.” They chose 60 students by maximum variation sampling, a purposive method that deliberately picks people who differ, and ran eight online focus groups from a guide of seven open-ended questions. They stopped when “saturation had been reached”. The analysis produced four themes: educational impact, time management, challenges encountered, and preferences for the future. Evidence again comes as quotations: “Online sessions provided me with a great time to study and I experienced better time management.”
The quantitative study. Çakmakkaya et al. (2024) “aimed to determine students’ overall satisfaction with their online learning experience and to define the main factors affecting students’ satisfaction” at Cerrahpaşa Medical Faculty in Istanbul. They sent a 24-question survey to all 1,600 medical students; “The response rate of the questionnaire was 66% (1050/1600).” The outcome was a single rating: “How would you rate your overall satisfaction level on a scale from 1 to 10”. The mean was 6.42. Multivariable linear regression then showed which factors were linked to that number: interactive teaching (β = 0.54) went with higher satisfaction and technical problems (β = -0.19) with lower.
What the pair shows. One study heard from 60 students and the other from 1,050, and both numbers fit their purpose: Khalil et al. needed discussions that stopped producing new ideas, Çakmakkaya et al. needed enough responses to estimate each factor. The survey names technical problems as a predictor; the focus groups let a student describe “Slow internet connectivity and communication software failure”. The verbs in each aim, “explore” against “determine” and “define”, already signal the approach. Our research question examples take that wording apart for more studies.
What does a mixed methods study look like?
A mixed methods study collects both kinds of data and then brings them together, so each strand answers a part of the question the other cannot. Integration is what makes it mixed methods: a study that runs a survey and some interviews but never compares them is two studies stapled together. The two strands run at the same time or one after the other.
Gough et al. (2023) studied older adults in Adelaide, Australia, before, during and after lockdown, the topic of Pair 1. In their convergent design the “quantitative data from observations and qualitative data from semi-structured interviews were collected, analysed separately and compared”. Twenty-six participants wore GPS trackers and accelerometers and kept diaries at three time points; nineteen were also interviewed.
The numbers showed what changed: trips out of home fell during restrictions (p = 0.021), and moderate-to-vigorous activity dropped for 73% of participants (though no pairwise change in activity survived correction for multiple comparisons). The interviews explained how people responded, in five themes from “Reframing of meaning” to “Future planning”. The most useful moment came when the strands disagreed. On a standard questionnaire, “Loneliness levels did not change significantly”, yet “from the qualitative data it was apparent that some participants struggled with social isolation and feelings of loneliness during social distancing restrictions, yet others were not affected, and some even enjoyed them.” A flat average hid experiences that went in opposite directions; the authors also suggest the scale was not sensitive enough. The glossary entry on mixed methods describes the three core designs.
Qualitative vs quantitative data: is it the same as the research approach?
No. In statistics, qualitative data means categories and quantitative data means numbers from counting or measuring. In research methods, qualitative and quantitative name whole approaches. The two senses overlap without matching: a survey answer of “less than usual” is categorical, qualitative data in the statistical sense, yet a study that counts such answers is quantitative research.
OpenStax’s Introductory Statistics puts the data definitions plainly: qualitative data “are the result of categorizing or describing attributes of a population”, such as hair colour or blood type, while “Quantitative data are always numbers.” Under that definition, Bevilacqua et al.’s three answer options are categories. The study is still quantitative because it turns the categories into percentages and compares groups.
The reverse also happens: Çakmakkaya et al.’s survey ended with seven open-ended questions, which produce text, yet a few open questions do not make a mixed methods study. So ask two separate questions. Is each answer a number or a category? That decides the data type. How will the answers be analysed and reported? That decides the approach.
Is qualitative or quantitative research better?
Neither is better in general; each is better at a different question. Quantitative research is the stronger choice for estimating how common something is, comparing groups or testing whether one variable predicts another, and its results generalise to a population when the sample is representative. Qualitative research is the stronger choice when the question is how or why, or when too little is known to say what should be measured.
Quantitative research gains from asking a fixed question the same way of everyone, which others can repeat and check, and from samples large enough for statistical tests; it loses depth, as Bevilacqua et al. could report 47% but not what that felt like. Qualitative research captures context, surprises and the participants’ own categories, at the cost of statistical generalisation. StatPearls notes that the approaches are “neither necessarily opposites, nor are they incompatible”, and that a project often starts qualitatively to generate a hypothesis that quantitative methods then test.
Qualitative vs quantitative research in a thesis: which should you choose?
Start from the research question you can defend, then let its wording choose the approach. A question about amounts, differences, relationships or effects needs measurable variables and a sample big enough for statistics. A question about experiences, meanings or processes needs open data and a purposeful sample. If the question has both parts, plan a mixed methods design.
| If your question starts with… | Approach | Example from this article |
|---|---|---|
| How do / what is it like / why do | Qualitative | How older adults experienced the first lockdown |
| How many / what proportion / how much | Quantitative (descriptive) | Share of participants less active than before |
| Is there a difference between / what predicts | Quantitative (comparative or correlational) | Factors linked to satisfaction with online learning |
| Does X cause / what is the effect of | Quantitative (experimental) | Not in this article: needs an experiment |
| How much changed, and how did people experience it | Mixed methods | GPS and interview study in Adelaide |
Then check what you can deliver: enough participants for a statistical test, or a dozen people who know the topic well; a validated questionnaire for what you want to measure; time to transcribe and code; and a department that accepts the approach for your degree. If a variable cannot be defined and measured yet, the topic needs qualitative work first. Our guide to independent and dependent variables shows what a measurable variable looks like. Once the approach is settled, our overview of types of research methodology compares the designs inside it, from experiments to case studies.
How is each approach written up in a thesis methodology chapter?
A thesis or dissertation methodology chapter has to justify the approach, not only describe it. A quantitative chapter states the design, the population, how the sample size was set, the instruments and their reliability and validity, and the statistical tests. A qualitative chapter states the approach, the sampling strategy and saturation, how data were collected and coded, how trustworthiness was established, and the researcher’s own position.
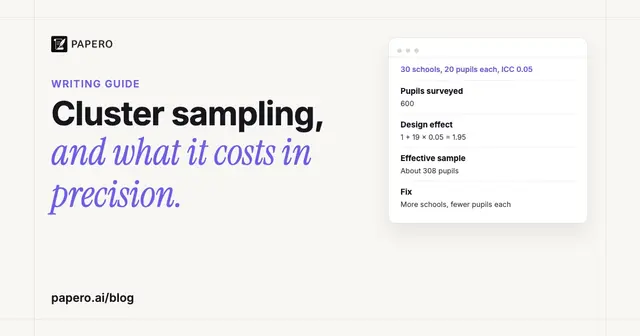
Sampling and sample size. Moser and Korstjens (2018) explain that “In quantitative studies, the sampling plan, including sample size, is determined in detail in beforehand”, while in qualitative work “Data saturation determines sample size and will be different for each study.” So a quantitative chapter reports a calculation or a whole-population invitation (Çakmakkaya et al. invited all 1,600 students), and a qualitative chapter reports how saturation was judged (in Khalil et al., the moderators agreed on it). The STROBE checklist for observational studies asks authors to “Explain how the study size was arrived at”. When participants are drawn in groups, such as whole classes or schools, that calculation needs a design effect, which our cluster sampling guide works through with numbers.
Quality criteria. Quantitative chapters argue for reliability and validity: OpenStax’s Psychology 2e defines reliability as “the ability to consistently produce a given result” and validity as “the extent to which a given instrument or tool accurately measures what it’s supposed to measure”. Qualitative chapters use a different vocabulary. Korstjens and Moser (2018) list the best-known criteria as “credibility, transferability, dependability, and confirmability as defined by Lincoln and Guba”, and describe credibility as “the equivalent of internal validity in quantitative research”. They add reflexivity, “critical self-reflection about oneself as researcher”. StatPearls adds that understanding a study’s philosophical base lets researchers “reflect on their positionality and bias”, so the methodology chapter is the place to say who you are in relation to the participants.
Reporting standards. Name the checklist your design follows. The EQUATOR Network lists SRQR for qualitative research in general and COREQ, a 32-item checklist, for interview and focus group studies (Bloom et al. attached a completed COREQ checklist). CONSORT covers randomised trials and STROBE covers cohort, case-control and cross-sectional studies; Çakmakkaya et al. followed CHERRIES for internet surveys. In psychology, APA publishes separate standards: JARS-Quant, JARS-Qual and JARS-Mixed.
Results versus findings. Korstjens and Moser note that quantitative papers keep a strict line between Results and Discussion, while “the Findings section in qualitative papers consists mostly of synthesis and interpretation”. So a quantitative results chapter holds tables and tests and leaves meaning for the discussion, and a qualitative findings chapter is organised by theme, with quotations, and interprets as it goes. Our guides to writing a methodology section and writing a discussion section cover each chapter in full.
Where Papero fits
Papero is an AI writing workspace for students and researchers. Its outline builder offers a standard IMRaD structure with a prompt for every section; the Methods prompt asks for “Design, participants or materials”, “Procedure and measures” and “How the data were analysed”, which is where a qualitative or quantitative choice gets justified. Find papers searches more than 250 million papers through OpenAlex, which helps when you need published studies that used your approach on your topic.
The thesis writing page shows how chapter outlines, one source library, version history and Review work across a long project. Choosing the approach, and defending it in front of your committee, stays your job.
Frequently Asked Questions
How do I know if my data is qualitative or quantitative?
Look at a single answer. A number from counting or measuring, such as an age or a score, is quantitative data. A category or a description, such as “less than usual” or an interview transcript, is qualitative data. Counting categories into percentages is still quantitative research.
What are the pros of quantitative research?
Quantitative research gives precise, comparable numbers, such as the share of a population that changed a behaviour. Asking everyone the same fixed question lets other researchers repeat and check the study, and a large, representative sample supports statistical tests and generalisation.
What is quantitative research design?
Quantitative research design is the plan for measuring variables and analysing them with statistics. The main types are descriptive, correlational, quasi-experimental and experimental, the last with random assignment to conditions. Cross-sectional designs measure once; longitudinal designs follow the same people over time.
Is a survey qualitative or quantitative?
A survey of closed questions with fixed answer options is quantitative, because the answers are counted and analysed statistically. A survey of open-ended questions produces text, which is analysed qualitatively. A few open questions on a closed survey do not turn it into a mixed methods study.
Can a thesis use both qualitative and quantitative research?
Yes. A mixed methods thesis collects both kinds of data and integrates them, for example a questionnaire to measure how common something is and interviews to explain it. Its methodology chapter has to explain the order of the two strands and how they were combined.
Sources
- American Psychological Association. (n.d.). Journal Article Reporting Standards: Quantitative research design (JARS-Quant), qualitative research design (JARS-Qual), mixed methods research design (JARS-Mixed). APA Style. https://apastyle.apa.org/jars/quantitative, https://apastyle.apa.org/jars/qualitative and https://apastyle.apa.org/jars/mixed-methods
- Bevilacqua, G., D’Angelo, S., Linaker, C., Paul, A., Bloom, I., Zhang, J., Laskou, F., Cooper, C., Ward, K. A., Walker-Bone, K., & Dennison, E. M. (2022). Physical activity and diet in a global pandemic: An investigation of the impact of COVID-19 on factors relevant for musculoskeletal health at two different stages of the lifecourse. Frontiers in Endocrinology, 13, Article 882399. Licence: CC BY. https://doi.org/10.3389/fendo.2022.882399
- Bloom, I., Zhang, J., Hammond, J., Bevilacqua, G., Lawrence, W., Ward, K. A., Cooper, C., & Dennison, E. M. (2022). Impact of the COVID-19 pandemic on community-dwelling older adults: A longitudinal qualitative study of participants from the Hertfordshire Cohort Study. PLOS ONE, 17(10), Article e0275486. Licence: CC BY. https://doi.org/10.1371/journal.pone.0275486
- Çakmakkaya, Ö. S., Meydanlı, E. G., Kafadar, A. M., Demirci, M. S., Süzer, Ö., Ar, M. C., Yaman, M. O., Demirbaş, K. C., & Gönen, M. S. (2024). Factors affecting medical students’ satisfaction with online learning: A regression analysis of a survey. BMC Medical Education, 24, Article 11. Licence: CC BY. https://doi.org/10.1186/s12909-023-04995-7
- EQUATOR Network. (n.d.). Reporting guidelines: SRQR, COREQ, STROBE and CONSORT. https://www.equator-network.org/reporting-guidelines/srqr/, https://www.equator-network.org/reporting-guidelines/coreq/, https://www.equator-network.org/reporting-guidelines/strobe/ and https://www.equator-network.org/reporting-guidelines/consort/
- Gough, C., Barr, C., Lewis, L. K., Hutchinson, C., Maeder, A., & George, S. (2023). Older adults’ community participation, physical activity, and social interactions during and following COVID-19 restrictions in Australia: A mixed methods approach. BMC Public Health, 23, Article 172. Licence: CC BY. https://doi.org/10.1186/s12889-023-15093-0
- Illowsky, B., & Dean, S. (2023). Introductory statistics 2e, Section 1.2, Data, sampling, and variation in data and sampling. OpenStax. https://openstax.org/books/introductory-statistics-2e/pages/1-2-data-sampling-and-variation-in-data-and-sampling
- Khalil, R., Mansour, A. E., Fadda, W. A., Almisnid, K., Aldamegh, M., Al-Nafeesah, A., Alkhalifah, A., & Al-Wutayd, O. (2020). The sudden transition to synchronized online learning during the COVID-19 pandemic in Saudi Arabia: A qualitative study exploring medical students’ perspectives. BMC Medical Education, 20, Article 285. Licence: CC BY. https://doi.org/10.1186/s12909-020-02208-z
- Korstjens, I., & Moser, A. (2018). Series: Practical guidance to qualitative research. Part 4: Trustworthiness and publishing. European Journal of General Practice, 24(1), 120–124. https://doi.org/10.1080/13814788.2017.1375092
- Moser, A., & Korstjens, I. (2018). Series: Practical guidance to qualitative research. Part 3: Sampling, data collection and analysis. European Journal of General Practice, 24(1), 9–18. https://doi.org/10.1080/13814788.2017.1375091
- Spielman, R. M., Jenkins, W. J., & Lovett, M. D. (2020). Psychology 2e, Section 2.3, Analyzing findings. OpenStax. https://openstax.org/books/psychology-2e/pages/2-3-analyzing-findings
- STROBE. (n.d.). STROBE statement: Checklist of items that should be included in reports of cross-sectional studies (version 4). EQUATOR Network. https://www.equator-network.org/reporting-guidelines/strobe/STROBE_checklist_v4_cross-sectional.pdf
- Tenny, S., Brannan, J. M., & Brannan, G. D. (2022). Qualitative study. In StatPearls. StatPearls Publishing. https://www.ncbi.nlm.nih.gov/books/NBK470395/