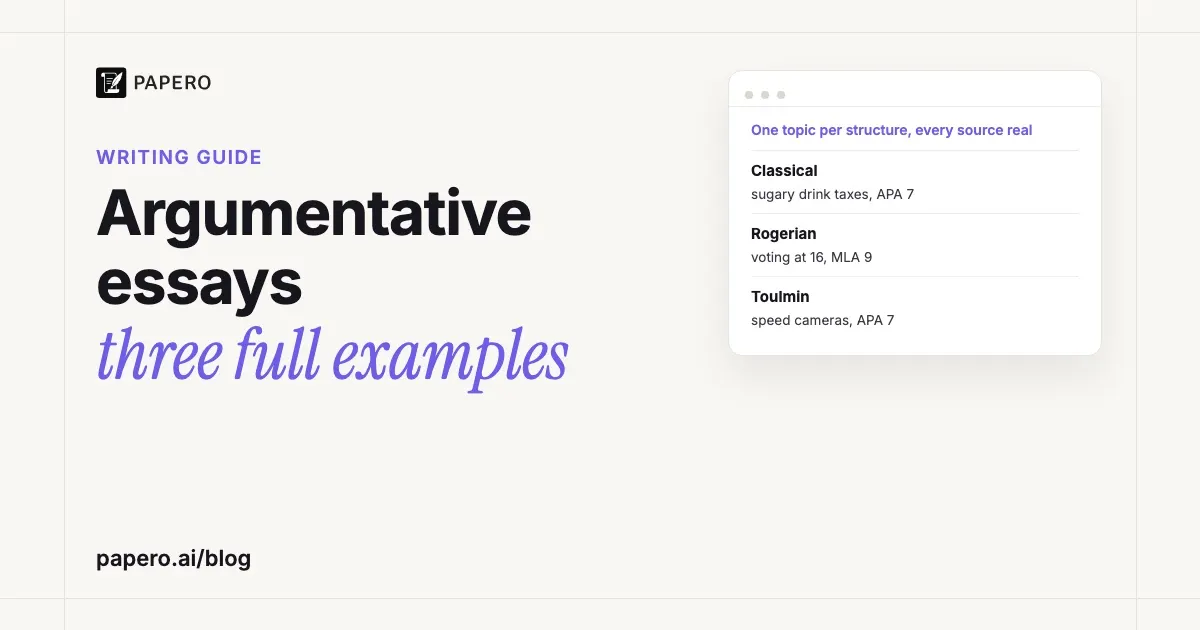
An argumentative essay takes a position that a reasonable reader could reject, defends it with evidence, and answers the strongest objection. Below are three argumentative essay examples, each a complete essay we wrote for this guide in a different structure: Classical (sugary drink taxes), Rogerian (voting at 16) and Toulmin (speed cameras). Every source is real and listed.
Key Takeaways
- An argumentative essay wins with evidence and reasoning and must deal honestly with the other side.
- Classical, Rogerian and Toulmin arrange the same parts for different readers: undecided (Classical), already opposed (Rogerian), or testing one claim (Toulmin).
- The strongest counterargument paragraphs concede something true, then show why the thesis survives it.
- Graders reward a defensible thesis, specific evidence for every claim, and commentary that explains how the evidence supports it.
- Every statistic in the three essays comes from a government agency, the World Health Organization or a journal article, cited in APA 7 or MLA 9.
What makes an essay argumentative?
An essay is argumentative when its thesis takes a side that informed readers could dispute, and the body proves that side with evidence rather than feeling. It also has to treat the opposing view fairly: state it at its strongest, then concede part of it, narrow the claim, or answer it with better evidence.
Purdue OWL puts the rule plainly: “It is unethical to exclude evidence that may not support the thesis.” That is the main line between argument and persuasion. A persuasive essay may skip the other side and lean on feelings, as our annotated persuasive essay example does on purpose. Papero’s glossary defines the argumentative essay and its parts.
Classical, Rogerian or Toulmin: which structure fits?
Choose the structure by your reader. Classical order suits a reader who has not decided and wants the full case, with the objections answered near the end. Rogerian order suits a reader who already disagrees, because it states and credits their view before yours. Toulmin order suits one claim whose logic has to hold up step by step, with its limits stated.
Purdue OWL calls these “only three of the most popular models for organizing an argument” and adds: “Alternatives exist.”
| Classical (Aristotelian) | Rogerian | Toulmin | |
|---|---|---|---|
| Order of parts | Introduction, background, proposition, proof, refutation, conclusion | Introduction, opposing view, statement of validity, your position, contexts, benefits | Claim, grounds, warrant, backing, qualifier, counterclaim, rebuttal |
| Where the other side goes | A refutation section after your proof | Second, before your own position | After the support, as counterclaim and rebuttal |
| Tone toward opponents | Confident; answers them | Generous; agrees where it can | Precise; limits the claim |
| Example below | Sugary drink taxes, APA 7 | Voting at 16, MLA 9 | Speed cameras, APA 7 |
Purdue’s Toulmin list has no qualifier; San José State University’s Writing Center adds one as “a technique rather than a physical section”, usually a word such as “presumably”. The third essay gives it a paragraph so the part is easy to see. To plan any of these before drafting, see our argumentative essay outline. For a single paragraph, school science classes teach a shorter version of the same moves: claim, evidence and reasoning.
Argumentative essay example 1: Classical structure
This essay argues that cities should tax sugary drinks at a penny an ounce or more. It runs about 670 words, one paragraph per part of the classical structure, with APA 7 citations. We wrote it for this guide; it is a model to study, not to submit.
A Penny an Ounce: Why Cities Should Tax Sugary Drinks
Paragraph 1: introduction (exordium)
On a given day in 2011 to 2014, about half of American adults and nearly two thirds of young people drank at least one sugar-sweetened beverage (Centers for Disease Control and Prevention, 2026). Those drinks are among the leading sources of added sugars in the American diet, and drinking them often is associated with weight gain, type 2 diabetes and heart disease (Centers for Disease Control and Prevention, 2026). Warnings alone leave untouched the price that keeps the habit cheap. Cities have a tool that can change it.
Notes: two facts from a federal source establish that the issue matters, with the survey years stated. The last two sentences point toward a remedy without stating the thesis yet.
Paragraph 2: background (narratio)
A sugar-sweetened beverage tax is an excise tax charged per ounce or per liter on drinks with added sugar. Mexico brought in a national tax of one peso per liter on January 1, 2014, roughly a 10% price increase (Colchero et al., 2016). In March 2015, Berkeley, California, became the first U.S. jurisdiction to tax sugary drinks, at one cent per ounce (Falbe et al., 2016). Philadelphia followed in January 2017 with a tax of 1.5 cents per ounce that also covers artificially sweetened drinks (Roberto et al., 2019). Together, these places give researchers years of data on what such taxes do.
Notes: neutral background, no claim. It defines the term and dates each case, so a reader who rejects the thesis should still accept every sentence.
Paragraph 3: proposition (propositio)
Cities should tax sugar-sweetened beverages at a penny an ounce or more. The case rests on two claims: sugary drinks carry a measurable health cost, and taxes on them reduce how much people buy and drink.
Notes: the thesis gets its own short paragraph. It names a policy and an amount, and previews the two claims the proof will defend.
Paragraph 4: proof (confirmatio)
The health cost is well documented. A meta-analysis of prospective cohort studies with 310,819 participants found that people in the highest category of sugary drink intake, most often one to two servings a day, had a 26% greater risk of developing type 2 diabetes than those who drank almost none (Malik et al., 2010). The taxes also do what they are meant to do. In low-income Berkeley neighborhoods, sugary drink consumption fell 21% after the tax, while it rose 4% in the comparison cities of Oakland and San Francisco (Falbe et al., 2016), and a later study of demographically diverse Berkeley neighborhoods found the reduction sustained over the tax’s first three years (Lee et al., 2019). In Mexico, purchases of taxed drinks were 6% lower than pretax trends predicted over 2014 and 12% lower by December (Colchero et al., 2016). The evidence comes from a city and a country, measured with different methods, and it points the same way.
Notes: claim 1 (health cost) rests on a meta-analysis; claim 2 (taxes work) on studies with comparison groups, which is why the 4% rise in Oakland and San Francisco matters. The last sentence is commentary: it says why the sources together outweigh any one of them.
Paragraph 5: refutation (refutatio)
The strongest objections are that the tax falls hardest on the poor and that shoppers will buy their soda elsewhere. Both deserve a direct answer. Adults with low incomes do drink more sugary beverages (Centers for Disease Control and Prevention, 2026), so they pay more of the tax, and economists list regressivity among the three factors that set the best tax rate (Allcott et al., 2019). Yet the cuts in purchases were largest in the same households: in Mexico, households of low socioeconomic status reduced their purchases the most, by 9% on average in 2014 and by up to 17% by December (Colchero et al., 2016). Weighing these effects, Allcott et al. (2019) report calculations suggesting that sugary drink taxes are welfare enhancing and that the best rate may be higher than one cent per ounce. Cross-border shopping is a real leak. In Philadelphia, sales of taxed drinks at large chain stores fell 51.0%, but rising sales just outside the city offset 24.4% of that decrease (Roberto et al., 2019). Even after the leak, about three quarters of the drop remained, and a county or state tax would close more of it.
Notes: counterargument: two objections in their strongest form. Rebuttal 1 concedes that low-income adults pay more, then shows those households cut their purchases the most. Rebuttal 2 concedes the leak, measures it and turns it into a design point. Neither pretends the objection is false, which matches Purdue OWL’s advice to show how other positions “may not be well informed” rather than wrong outright.
Paragraph 6: conclusion (peroratio)
A sugary drink tax will not end diabetes, and no one should sell it as a cure. It is a modest price signal with a record: people buy fewer sugary drinks when it is in place, and in Berkeley they kept drinking fewer three years on. For a city that wants healthier residents and has run out of new ways to say “drink less soda”, a penny an ounce is a small, tested place to start. Councils that adopt one should coordinate with their neighbors, so the drinks people stop buying in the city are not bought across the line.
Notes: the conclusion opens by conceding a limit, saves its appeal to values for the end, where Purdue OWL’s classical model has the conclusion cater “to the reader’s emotions and values”, and carries the rebuttal’s design point forward. Our guide on how to write a conclusion explains why a conclusion should synthesize rather than repeat.
References
Allcott, H., Lockwood, B. B., & Taubinsky, D. (2019). Should we tax sugar-sweetened beverages? An overview of theory and evidence. Journal of Economic Perspectives, 33(3), 202–227. https://doi.org/10.1257/jep.33.3.202
Centers for Disease Control and Prevention. (2026, April 14). Fast facts: Sugar-sweetened beverage consumption. U.S. Department of Health and Human Services. https://www.cdc.gov/nutrition/data-statistics/sugar-sweetened-beverages-intake.html
Colchero, M. A., Popkin, B. M., Rivera, J. A., & Ng, S. W. (2016). Beverage purchases from stores in Mexico under the excise tax on sugar sweetened beverages: Observational study. BMJ, 352, Article h6704. https://doi.org/10.1136/bmj.h6704
Falbe, J., Thompson, H. R., Becker, C. M., Rojas, N., McCulloch, C. E., & Madsen, K. A. (2016). Impact of the Berkeley excise tax on sugar-sweetened beverage consumption. American Journal of Public Health, 106(10), 1865–1871. https://doi.org/10.2105/AJPH.2016.303362
Lee, M. M., Falbe, J., Schillinger, D., Basu, S., McCulloch, C. E., & Madsen, K. A. (2019). Sugar-sweetened beverage consumption 3 years after the Berkeley, California, sugar-sweetened beverage tax. American Journal of Public Health, 109(4), 637–639. https://doi.org/10.2105/AJPH.2019.304971
Malik, V. S., Popkin, B. M., Bray, G. A., Després, J.-P., Willett, W. C., & Hu, F. B. (2010). Sugar-sweetened beverages and risk of metabolic syndrome and type 2 diabetes: A meta-analysis. Diabetes Care, 33(11), 2477–2483. https://doi.org/10.2337/dc10-1079
Roberto, C. A., Lawman, H. G., LeVasseur, M. T., Mitra, N., Peterhans, A., Herring, B., & Bleich, S. N. (2019). Association of a beverage tax on sugar-sweetened and artificially sweetened beverages with changes in beverage prices and sales at chain retailers in a large urban setting. JAMA, 321(18), 1799–1810. https://doi.org/10.1001/jama.2019.4249
Argumentative essay example 2: Rogerian structure
This essay argues that sixteen- and seventeen-year-olds should vote in local elections, and it is addressed to readers who think they are too young. It runs about 530 words in the Rogerian order Purdue OWL lists, with MLA 9 citations. We wrote it for this guide.
Votes at Sixteen, Starting Close to Home
Paragraph 1: introduction
Whether sixteen- and seventeen-year-olds should vote is usually argued as a yes-or-no question about maturity. It has also become a practical question. With its 2013 election, Takoma Park, Maryland, became the first jurisdiction in the United States to lower the voting age to sixteen, for city elections (Bond 1). In 2012, Austria was the only European country with a voting age of sixteen in nationwide elections (Wagner et al. 372), and Scotland lowered its voting age for its own elections following the 2014 independence referendum (Eichhorn 365). There is now evidence on how younger voters behave, and both sides of the debate can use it.
Notes: Purdue OWL asks the Rogerian introduction to stay “as objective as possible”. It frames the issue in terms both sides accept and holds back the writer’s position.
Paragraph 2: the opposing view
People who oppose a lower voting age are rarely dismissing teenagers. Their concern is the quality of democracy. As Markus Wagner and his coauthors summarize the position, critics “argue that such teenagers lack the ability and motivation to participate effectively in elections” (372). If that were true, adding them to the rolls would mean more votes cast with little thought behind them.
Notes: the opposing view, stated as its supporters would state it and quoted from a study that went on to test it. Calling it a concern for democracy describes the other side’s motive generously.
Paragraph 3: statement of validity
That concern has real support. In Austria, the same researchers found that “the turnout levels of young people under 18 are relatively low” (Wagner et al. 372). Interest in politics also varies widely at sixteen, as it does at forty. Skeptics are right that a vote should be an informed one, and a law that hands teenagers a ballot without preparing them for it would serve no one.
Notes: the concession uses evidence, not just politeness: low turnout is a real point for the other side. Purdue OWL describes this section as showing “how and why their perspective makes sense in a specific context.”
Paragraph 4: the writer’s position
The same evidence suggests, though, that age is not the problem. Wagner and his coauthors found that the low turnout of under-18s “cannot be explained by a lower ability or motivation to participate,” and that the quality of their vote choices “is similar to that of older voters” (372). In two Austrian regional elections, turnout among sixteen- and seventeen-year-olds was higher than among first-time voters aged eighteen to twenty and “not substantially lower than the average turnout rate” (Zeglovits and Aichholzer 351). Sixteen- and seventeen-year-olds should be allowed to vote in local elections.
Notes: claim: the last sentence, arriving only after the reader’s view has been credited. Evidence: the same study the opposing view relied on, plus turnout records from a second study. Limiting the thesis to local elections keeps it defensible.
Paragraph 5: contexts
The case is strongest in local elections, where the questions on the ballot, such as parks, buses and school buildings, are ones teenagers already know firsthand, and where students can study a ballot in class before they cast it. Research from Scotland points the same way. Comparing sixteen- and seventeen-year-olds in Scotland with their peers in the rest of the United Kingdom, Jan Eichhorn found “potentially significant positive effects” on political behavior, and highlighted the role of “parents and civic education in schools” (365). A city that lowers its voting age should pair the change with registration drives and civics lessons timed to the election.
Notes: the statement of contexts says where the position works best. The Scottish evidence supports the condition (civic education) as much as the claim, which answers the “informed vote” concern from paragraph 3.
Paragraph 6: benefits to the other side
This approach offers skeptics what they want. They want voters who take the ballot seriously and who keep voting. A first vote cast at sixteen, while a young person still lives at home and sits in a civics class, may be a better start to that habit than a first vote at eighteen, and the Austrian turnout figures point that way. Starting with city elections also keeps the stakes measured. If the results disappoint, a city can reverse course; if they match the Austrian findings, the next debate will have better evidence than this one.
Notes: the essay ends by showing skeptics how the position serves their own goal. The hedges (“may be”, “point that way”) match the strength of the evidence.
Works Cited
Bond, Eric. “A Decade of High School Students Speaking through the Ballot Box.” Takoma Park News, vol. 62, no. 12, Dec. 2023, pp. 1+, documents.takomaparkmd.gov/news/newsletter/2023/TPN_1223_FINAL.pdf.
Eichhorn, Jan. “Votes at 16: New Insights from Scotland on Enfranchisement.” Parliamentary Affairs, vol. 71, no. 2, 2018, pp. 365–91, https://doi.org/10.1093/pa/gsx037.
Wagner, Markus, et al. “Voting at 16: Turnout and the Quality of Vote Choice.” Electoral Studies, vol. 31, no. 2, 2012, pp. 372–83, https://doi.org/10.1016/j.electstud.2012.01.007.
Zeglovits, Eva, and Julian Aichholzer. “Are People More Inclined to Vote at 16 than at 18? Evidence for the First-Time Voting Boost among 16- to 25-Year-Olds in Austria.” Journal of Elections, Public Opinion and Parties, vol. 24, no. 3, 2014, pp. 351–61, https://doi.org/10.1080/17457289.2013.872652.
Argumentative essay example 3: Toulmin structure
This essay argues that cities should put automated speed cameras on the local roads with the worst crash records. It runs about 570 words in the Toulmin order, with a qualifier added and APA 7 citations. We wrote it for this guide.
Speed Cameras Belong on the Streets Where People Die
Paragraph 1: the claim
Speeding is one of the most stubborn problems in traffic safety. In 2024, 11,288 people died in speeding-related crashes in the United States, 29% of all traffic deaths that year (National Center for Statistics and Analysis, 2026). Cities cannot put an officer on every block, but they can put a camera on the blocks that matter most. Cities should install automated speed cameras on the local roads with the worst records of serious crashes.
Notes: claim: the last sentence, specific (automated cameras), limited (roads with the worst records) and debatable. One statistic sets the stakes.
Paragraph 2: grounds
The deaths happen mostly off the interstates. When the type of road was known, 87% of speeding-related deaths in 2024 occurred on roads other than interstates, and 52% on non-interstate roads in urban areas (National Center for Statistics and Analysis, 2026). And cameras change behavior on ordinary roads. Montgomery County, Maryland, began automated enforcement in 2007 on residential streets with limits of 35 mph or lower and in school zones. About seven and a half years later, the cameras were associated with a 10% reduction in mean speeds and a 62% reduction in the likelihood that a vehicle was going more than 10 mph over the limit at camera sites (Hu & McCartt, 2016).
Notes: grounds: where the problem is (national data) and whether the remedy changes behavior there (a county study with control sites in Virginia).
Paragraph 3: warrant and backing
The reasoning that joins these facts is that a measure which lowers speeds on the roads where speeding kills will prevent deaths. That warrant needs backing, because a few miles per hour can sound trivial. The World Health Organization (2026) reports that every 1% increase in mean speed produces a 4% increase in fatal crash risk and a 3% increase in serious crash risk, and that the risk of death for a pedestrian hit by the front of a car rises 4.5 times between 50 and 65 km/h (about 31 and 40 mph). Small reductions in speed therefore prevent a large share of the harm. The Montgomery County results bear this out: in its later form, after a change in state law and a corridor approach that moved cameras along whole stretches of road, the program was associated with a 39% reduction in the likelihood that a crash caused an incapacitating or fatal injury, and the cameras alone with a 19% reduction (Hu & McCartt, 2016).
Notes: warrant: the first sentence, stated outright because a skeptic might not grant it. Backing: the WHO figures. Both Montgomery County figures are reported, because the larger one also includes a law change and a new deployment method.
Paragraph 4: qualifier
The claim has limits. The Montgomery County results come from one county with its own rules, thresholds and road network, and other cities should expect different numbers. The recommendation is therefore for streets with documented crash problems, with signs, published camera locations and a clear margin over the limit before a ticket is issued, and with each city measuring its own results.
Notes: qualifier: it narrows the claim to what one county’s evidence supports, and its conditions prepare the answer to the counterclaim.
Paragraph 5: counterclaim
The strongest objection is that speed cameras are about money, not safety. Critics argue that they turn a public safety problem into a revenue stream, treat residents as suspects, and issue fines that weigh most on drivers who can least afford them.
Notes: counterclaim: three related objections, stated without sarcasm and given their own paragraph.
Paragraph 6: rebuttal
The answer lies in the design and in the results. A camera that slows traffic issues fewer tickets as drivers adjust, so a program that works should earn less over time, not more. Drivers who lived with the cameras did not reject them: in a 2014 survey of Montgomery County drivers, 95% knew about the program and 62% favored it (Hu & McCartt, 2016). Cities can meet the remaining concerns by placing cameras only where crash records justify them, publishing every location, spending fine revenue on street safety, and offering payment plans or reduced fines to low-income drivers. With 11,288 lives lost in one year, the burden of proof belongs to those who would leave these streets as they are.
Notes: rebuttal: one line of reasoning, one piece of evidence (drivers’ support after years with the cameras) and one design answer. The last sentence returns to the figure from paragraph 1.
References
Hu, W., & McCartt, A. T. (2016). Effects of automated speed enforcement in Montgomery County, Maryland, on vehicle speeds, public opinion, and crashes. Traffic Injury Prevention, 17(Suppl. 1), 53–58. https://doi.org/10.1080/15389588.2016.1189076
National Center for Statistics and Analysis. (2026). Speeding: 2024 data (Traffic Safety Facts Report No. DOT HS 813 823). U.S. Department of Transportation, National Highway Traffic Safety Administration. https://doi.org/10.21949/86b4-hv17
World Health Organization. (2026, July 20). Road traffic injuries. https://www.who.int/news-room/fact-sheets/detail/road-traffic-injuries
In a paper, each reference list starts on a new page and each entry has a hanging indent, which this page cannot show.
Introduction for argumentative essay examples
An argumentative essay introduction sets up the debate, shows why it matters, and states or prepares the thesis. Where the thesis goes depends on the structure: a classical essay states it after the background, a Rogerian essay delays it until the reader’s view has been heard, and a Toulmin essay often opens with the claim itself.
Purdue OWL’s guide expects a thesis “that occurs in the first paragraph of the essay”; if your assignment does too, move the classical proposition up to close paragraph 1. For more ways to open, see our hook examples for essays.
What do graders look for in an argumentative essay?
Graders look for three things: a thesis that takes a defensible position, specific evidence for every claim in a line of reasoning, and commentary that explains how that evidence supports the claim. The AP rubric adds a point for sophistication, such as exploring the argument’s limits or tensions.
The clearest public example is the AP English Language and Composition exam, where question 3 is the argument essay: students write an essay that argues their position on a concept or idea using evidence, with about 40 minutes recommended per essay. Its rows, quoted from the College Board’s course and exam description (fall 2024 edition, read November 1, 2026):
| Row | Points | What earns the top score | Where the examples show it |
|---|---|---|---|
| A. Thesis | 0-1 | “Responds to the prompt with a thesis that presents a defensible position.” | All three theses could be rejected by an informed reader |
| B. Evidence and commentary | 0-4 | “Provides specific evidence to support all claims in a line of reasoning” and “Consistently explains how the evidence supports a line of reasoning.” | The proof, grounds and position notes name the claim each piece of evidence supports |
| C. Sophistication | 0-1 | “Demonstrates sophistication of thought and/or a complex understanding of the rhetorical situation.” | The refutation, validity and qualifier paragraphs |
Responses that “Only restate the prompt” do not earn Row A, and neither do those whose position is “vague or must be inferred.” Row C is not earned by responses that “Only hint at or suggest other arguments”, and the rubric gives “While some may argue that” and “Some people say” as examples. If you raise a counterargument, state it and answer it. Question 1 is scored on the same three rows, except that Row B also requires evidence from at least three of the provided sources; our synthesis essay example walks through it.
How do you write an argumentative research essay?
An argumentative research essay starts from a question, not a position. Read the strongest sources on both sides, decide what the evidence supports, write a thesis that claims no more than that, and plan one paragraph per claim plus one for the best objection.
Here is how the three essays above were built:
- Use the primary source behind every number: the study or report itself, not a news story about it.
- Read past the headline. The Philadelphia study pairs its 51.0% drop with a 24.4% offset outside the city; quoting only the first number would misrepresent it.
- Find the best study against you. The voting essay’s opposing view comes from a paper that tested it.
- Check every reference. We looked up each DOI and copied titles, volumes and pages from Crossref and PubMed records.
- Claim no more than the evidence. The speed camera claim covers roads with crash records because that is where the evidence comes from.
Where Papero fits
Papero is an AI writing workspace for students and researchers. Describe the essay, pick a citation style and a structure, and Papero builds a two-level outline with a prompt for every section, or choose no headings and set out the classical, Rogerian or Toulmin order yourself.
Citation search finds real scholarly papers for the sentence you are writing, or looks one up by DOI, and formats it in APA 7, MLA 9 or seven other styles. Among the Review checks, Claims finds sentences that need a citation and offers papers to cite, and the source check flags cited papers that are retracted or preprints. In-text citations work on every plan; the full reference list is readable and exportable on Plus. Papero drafts only from your outline and prompts, so the position, the concessions and the rebuttal stay yours. The essay writing page shows where it helps and where it stops.
Frequently Asked Questions
What are the three types of argumentative essays?
The three common structures are Classical (Aristotelian), Rogerian and Toulmin. Classical order presents background, a proposition, proof and a refutation. Rogerian order states and credits the opposing view before giving your own. Toulmin order builds one claim from grounds, a warrant and backing, then adds a qualifier, a counterclaim and a rebuttal.
How many paragraphs is an argumentative essay?
A short argumentative essay usually has five or six paragraphs: an introduction, two or three body paragraphs, one for the counterargument and rebuttal, and a conclusion. Each example in this guide has six. Longer research essays give each claim several paragraphs, so the word count matters more than a paragraph count.
What is the difference between a counterargument and a rebuttal?
A counterargument is the strongest objection to your thesis, stated fairly, ideally in words its supporters would accept. A rebuttal is your answer to it: you concede what is true, show that the evidence behind the objection does not apply, or show that your reasons outweigh it. An essay needs both, because a counterargument left unanswered weakens the thesis.
Can you use “I” in an argumentative essay?
It depends on the assignment. The three examples here avoid “I” and let the evidence carry the argument, which is the safer default for academic work. Some instructors allow it, especially in a Rogerian essay that speaks directly to a reader. Either way, keep “I think” out of the thesis, because it weakens the claim.
How many sources does an argumentative essay need?
The assignment decides, but every factual claim needs a source. The three examples in this guide use seven, four and three. Fewer, stronger sources beat many weak ones: a government report or a peer-reviewed study carries more weight than several articles repeating the same number.
Sources
- Purdue OWL, “Argumentative Essays” (owl.purdue.edu, accessed November 2026): https://owl.purdue.edu/owl/general_writing/academic_writing/essay_writing/argumentative_essays.html
- Purdue OWL, “Organizing Your Argument” (owl.purdue.edu, accessed November 2026): https://owl.purdue.edu/owl/general_writing/academic_writing/establishing_arguments/organizing_your_argument.html
- San José State University Writing Center, “Toulmin’s Model of Argumentative Writing” (handout, spring 2024): https://gcp-web.sjsu.edu/writingcenter/docs/handouts/Toulmin%20Model%20of%20Argumentative%20Writing.pdf
- College Board, AP English Language and Composition Course and Exam Description, fall 2024 edition (question 3 scoring guidelines; read November 1, 2026): https://apcentral.collegeboard.org/pdf/ap-english-language-and-composition-course-and-exam-description.pdf
- APA Style, “Webpage on a Website References” and “Report by a Government Agency References” (apastyle.apa.org, read via the Internet Archive, November 2026): https://apastyle.apa.org/style-grammar-guidelines/references/examples/webpage-website-references
- Curtin University Library, “APA 7th referencing: Journals” (supplement issues; accessed November 2026): https://uniskills.library.curtin.edu.au/referencing/apa7/journals
- Centers for Disease Control and Prevention, “Fast Facts: Sugar-Sweetened Beverage Consumption” (cdc.gov, April 14, 2026): https://www.cdc.gov/nutrition/data-statistics/sugar-sweetened-beverages-intake.html
- National Center for Statistics and Analysis, Speeding: 2024 Data, Traffic Safety Facts DOT HS 813 823 (NHTSA, July 2026): https://doi.org/10.21949/86b4-hv17
- World Health Organization, “Road traffic injuries” fact sheet (who.int, July 20, 2026): https://www.who.int/news-room/fact-sheets/detail/road-traffic-injuries
- City of Takoma Park, Takoma Park News, December 2023 (vol. 62, no. 12): https://documents.takomaparkmd.gov/news/newsletter/2023/TPN_1223_FINAL.pdf
- The ten journal articles cited in the essays are listed in full, with DOIs, in the reference lists under each essay: Allcott et al. (2019), Colchero et al. (2016), Eichhorn (2018), Falbe et al. (2016), Hu and McCartt (2016), Lee et al. (2019), Malik et al. (2010), Roberto et al. (2019), Wagner et al. (2012) and Zeglovits and Aichholzer (2014).