Convenience sampling is a non-probability sampling method in which the researcher studies whoever is easiest to reach: students in their own department, patients at one clinic, people who answer an online link. It is quick and cheap, but nobody knows each person’s chance of selection, so the results describe the people who were reachable, not the wider population. This guide shows how large that gap can get.
Key Takeaways
- A convenience sample is chosen for access: proximity, availability at the time, or willingness to take part. It is also called accidental or haphazard sampling.
- Because selection chances are unknown, confidence intervals and p-values describe random error only, not the bias from who was reachable.
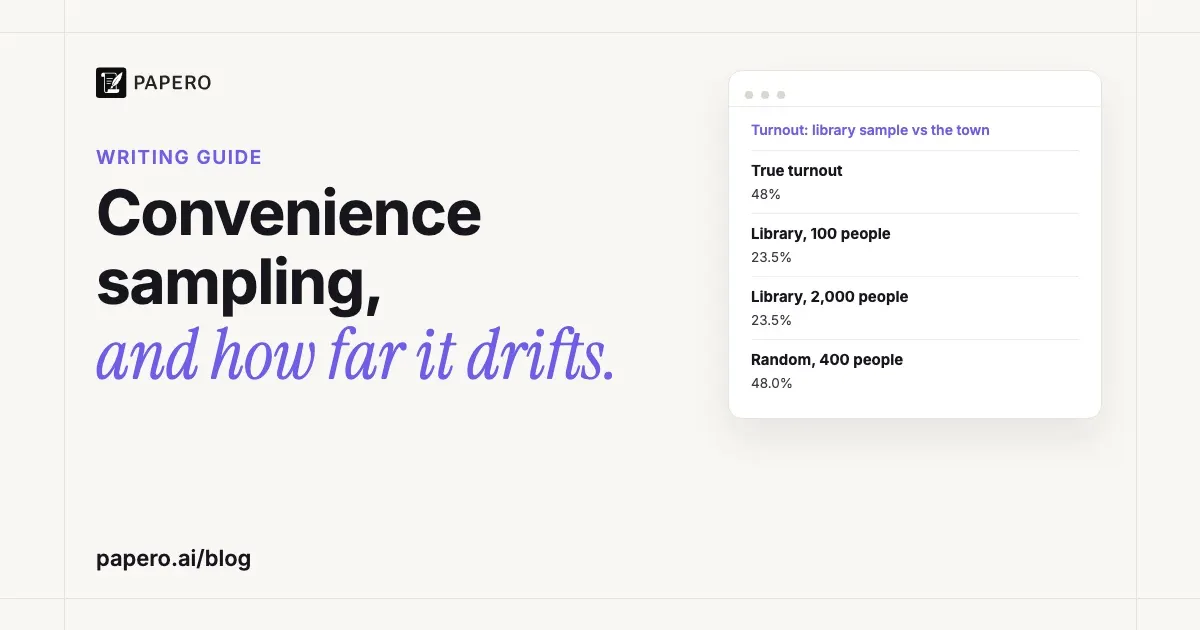
- A bigger sample from the same place does not fix the bias. In our simulation, 2,000 people outside a campus library put turnout at 23.5% against a true 48%.
- It is acceptable for feasibility pilots, exploratory and much qualitative work, and whenever you limit your conclusions to the group you reached.
- In the methods, report where, when and how you recruited and the response rate; in the limitations, name who is over-represented and which way that pushes your results.
What is convenience sampling?
Convenience sampling means selecting participants because they are easy to reach, not because they were drawn at random from the population you want to describe. The researcher stands in one place, uses one list or posts one link, and studies whoever turns up and agrees. It is the usual fallback when no full list of the population exists and drawing whole groups at random is not practical either, which is most of the time.
Etikan, Musa and Alkassim define it as “a type of nonprobability or nonrandom sampling where members of the target population that meet certain practical criteria, such as easy accessibility, geographical proximity, availability at a given time, or the willingness to participate are included for the purpose of the study.” They also give its other names, haphazard sampling and accidental sampling. They quote the case most students recognise: “captive participants such as students in the researcher’s own institution.”
Elfil and Negida call it “the most applicable and widely used method” in clinical research. Andrade goes further: because nobody can list every person with a condition and draw at random from that list, “Research, therefore, is almost always conducted on convenience samples.”
Convenience sampling examples
Typical convenience samples are students approached on your own campus, patients attending one or two hospitals, everyone who answers an emailed survey link, and field counts taken where access is easy. Each draws from the people or places at hand, so each over-represents a predictable group. The table lists six examples: our own worked example and five from the sources in this guide.
| Example | Who gets in | Who is likely to be over-represented |
|---|---|---|
| Questionnaires handed out outside a campus library (our worked example below) | Whoever walks past while you stand there | Students who use the library |
| Hepatitis C patients at two university hospitals (Elfil and Negida) | Every eligible patient attending during the study period | Patients who reach a university hospital |
| A survey emailed to all 27,372 students of one Malaysian university (Loo et al., 2022) | The 11.4% who replied | Women (76.4% of respondents) and, the authors suggest, health-conscious students |
| A hypothetical study of Nigerian students’ study habits, run only at the lecturer’s own university (Etikan et al.) | Students of one university | That university’s intake |
| Ecological counts along roads, trails and near camp (Etikan et al.) | Plants or animals near the access route | Habitats close to roads |
| Healthy controls recruited from the researcher’s friends and colleagues (Andrade) | People the researcher knows | Friends with healthy habits, if the researcher picks them |
The last row is Andrade’s “particularly egregious” example, a hypothetical study comparing blood micronutrients in patients with schizophrenia at the researcher’s hospital against friends and colleagues who gave blood. The only valid conclusion is about that hospital’s patients compared with those friends, a question nobody set out to answer.
Is convenience sampling probability or non-probability sampling?
It is non-probability sampling. A probability sample needs every member of the population to have a known, nonzero chance of selection, fixed in advance. In a convenience sample, the chance depends on where people happen to be and whether they agree, and nobody can calculate it. Without known chances, the usual sampling-error formulas say nothing about the gap between sample and population.
Andrade adds a twist that most explainers skip. A random sample of pupils from one rural government school can count as a probability sample of that school; such samples are non-probability samples, in his words, “only if the results are sought to be generalized to the entire population.” That gives two separate questions to ask of any sample:
- Where did it come from? The whole target population, or an accessible part of it, such as one school or one website?
- How were people picked within that source? At random from a list, or whoever turned up and agreed?
Random picks from one school support claims about that school. Whoever turned up at one school may not represent even that school. Andrade’s hypothetical case is a study that recruited alcohol-dependent patients only on the days a research student was on duty, biased “in known or unknown ways” even for that one treatment centre.
Convenience vs purposive vs snowball vs random sampling
Convenience sampling picks people for access, purposive sampling picks them for a characteristic the study needs, snowball sampling asks participants to recruit others like them, and random sampling gives everyone a known chance of selection. Only the random designs support statistical generalisation to a population; the other three are non-probability methods with different uses.
| Method | How people are chosen | Typical use | Generalises to |
|---|---|---|---|
| Convenience | Availability and access | Pilots, student projects, many clinical and online studies | The group you could reach |
| Purposive (judgmental) | The researcher picks people with the characteristics the study needs | Qualitative interviews, a defined subgroup | People with those characteristics, in that setting |
| Snowball | Each participant introduces others from the same population | Hidden groups with no list, such as street children | Only the networks reached |
| Simple random | Every member has a known, equal chance, usually from a list | Surveys that need population estimates | The population on the list |
| Stratified random | Random within subgroups, such as year of study | Estimates that must cover small subgroups | The population, each subgroup covered |
| Cluster random | Random groups (schools, wards), then people within them | Large populations with no list of individuals | The population the clusters came from |
Elfil and Negida’s snowball example is a survey of street children, where no list exists and each child passes the survey to others. They warn that judgmental sampling is “widely criticized due to the likelihood of bias by investigator judgement.” Andrade’s point about purposive samples is that every inclusion criterion narrows who the results apply to. Our guides to stratified sampling and cluster sampling cover the two random designs students most often confuse.
How much bias can a convenience sample add? A worked example
A convenience sample’s error comes from who it reaches, and a larger sample from the same place repeats that error more precisely. In the constructed example below, a survey outside a campus library estimates local election turnout at about 23.5% when the true value is 48%, at 100, 400 or 2,000 respondents alike. Random samples of the same sizes centre on 48%.
The inputs (constructed for this example). A town has 50,000 adults: 10,000 students and 40,000 other residents. In the last local election, 20% of students voted and 55% of other residents did. A researcher hands out questionnaires outside the university library, where 90% of passers-by are students.
The arithmetic. True turnout is (10,000 × 0.20 + 40,000 × 0.55) ÷ 50,000 = 24,000 ÷ 50,000 = 48%. The library sample is expected to give 0.90 × 0.20 + 0.10 × 0.55 = 23.5%, 24.5 points too low before a single form is handed out.
The simulation. We drew 2,000 samples of each size in Python, from the library and completely at random from all 50,000 adults, and computed the usual 95% confidence interval for each.
| Sample | Size | Average estimate | Middle 95% of estimates | Intervals containing 48% |
|---|---|---|---|---|
| Library (convenience) | 100 | 23.5% | 15.0% to 32.0% | 0% |
| Library (convenience) | 400 | 23.4% | 19.8% to 27.8% | 0% |
| Library (convenience) | 2,000 | 23.5% | 21.6% to 25.5% | 0% |
| Simple random | 100 | 48.1% | 38.0% to 58.0% | 93.4% |
| Simple random | 400 | 48.0% | 43.0% to 52.7% | 94.9% |
| Simple random | 2,000 | 48.0% | 45.9% to 50.1% | 95.7% |
Going from 100 to 2,000 people at the library narrowed the spread of estimates from 17 points to 4, around the wrong value. Not one of the 6,000 library intervals contained 48%, because a confidence interval measures chance variation between samples, not a sample that starts in the wrong place.
Can weighting rescue it? One simulated library sample of 400 held 353 students (78 voted, 22.1%) and 47 other residents (25 voted, 53.2%), a raw estimate of 103 ÷ 400 = 25.8%. Weighting the groups back to the town’s 20/80 split gives 0.20 × 22.1% + 0.80 × 53.2% = 47.0%. That works only because the non-students outside this library vote like non-students in general. If they were mostly university staff with 70% turnout, the same weighting would give 0.20 × 22.1% + 0.80 × 70% = 60.4%, now about 12 points too high. Weighting corrects the imbalance you can see, never the one you cannot.
Real data show the same pattern. Using nationally representative skills data from 32 countries, Wild, Kyröläinen and Kuperman found students scored on average 24 points above the general population in literacy and 22 in numeracy, and concluded that “undergraduate students are not representative of the general population nor age-matched non-students.” In Britain, Prah and colleagues compared 148 men who have sex with men from a national probability survey with three convenience surveys, the largest an online survey of 15,500 men. Size did not buy representativeness: 85% to 95% of men in the convenience surveys identified as gay, against 62% in the probability sample.
A real study: what a convenience sample can and cannot tell you
Loo and colleagues (2022) surveyed students at Universiti Kebangsaan Malaysia about chronic kidney disease. Their data support a precise description of the students who answered and comparisons within that group. They do not support a figure for all the university’s students, let alone all Malaysian students, and the authors say so in their limitations.
What they did. In July and August 2020 they emailed a Google Forms survey to 27,372 students, describing it as a convenience sample. 3,109 completed it, a response rate of 11.4%; after excluding 35 students with self-reported kidney disease, 3,074 remained. (One sentence in the results says 3,704; the tables use 3,074.)
The numbers. 32.6% of respondents (95% CI 31% to 34.3%) had below-average knowledge of the disease. Women were 76.4% of the sample (2,348 of 3,074). Men did worse: 36.9% (268 of 726) against 31.3% of women (735 of 2,348), an adjusted odds ratio of 1.26.
What it can and cannot conclude. About a third of the students who chose to answer had below-average knowledge, and within that group men, undergraduates and students outside the health faculties scored lower. Inviting every student is not random sampling when 88.6% do not reply: the 11.4% selected themselves, and the narrow interval reflects sample size only. The gender imbalance alone moves the estimate. If the student body were half men and half women (we do not know the real split), weighting the two rates equally would give 34.1% instead of 32.6%.
How they reported it. Their limitations paragraph names the design, the consequence and the likely direction of the bias:
“This was a single-centre, cross-sectional study that used non-probability sampling. Causal inferences may not be drawn, and the findings cannot be inferred to the whole student population. Selection bias may be present, where the participating students could be more health conscious and more inclined to answer the questions.”
If health-conscious students replied more often, the true share with below-average knowledge is probably higher than 32.6%, and the authors’ second worry, that students looked up answers before replying, points the same way. Saying which way a bias points turns a limitation from a disclaimer into information.
When is convenience sampling acceptable?
It is acceptable when the question does not need a population figure: testing whether a questionnaire works, checking recruitment in a pilot, exploring a new topic, or interviewing people about their experiences. It is also acceptable when you limit your conclusions to the group you sampled and say so. It is a poor choice for prevalence figures, averages or vote shares meant to describe a population.
Andrade states the condition: “there is nothing wrong with convenience and purposive sampling as long as readers are aware of the (sub)population to which the findings are relevant.” Four common cases meet it:
- Pilot and feasibility studies. Thabane and colleagues list what pilots test, including recruitment potential and whether participants understand the questionnaire. They add a caution: “It is important that the sample for a pilot be representative of the target study population,” with the main study’s inclusion criteria. A pilot run on classmates tells you little about recruiting nurses.
- Qualitative research, which aims at depth, not population figures. Purposive sampling is the usual choice, and our comparison of qualitative and quantitative research explains why the two approaches judge samples differently.
- Exploratory work, where a finding is a lead for a better-designed study.
- Comparisons inside the sample, such as men against women in Loo’s survey. These hold up better than one overall figure only if the reason people entered the sample is not tied to both variables, an assumption you have to argue.
How to describe convenience sampling in your methods and limitations
Name the method plainly, then give what a reader needs to judge it: where and when you recruited, through which channel, how many people you approached and how many took part. In the limitations, say who is over- or under-represented, which way that likely pushes your results, and which group your findings describe. Never call a convenience sample representative unless you checked it against population figures.
Etikan and colleagues set the standard: “It is compulsory for the researcher to describe how the sample would differ from the one that was randomly selected,” including who was likely excluded or over-represented. Our guide on writing a methodology section shows where those details sit. Here is a model pair built on the library example (bracketed parts are placeholders):
Methods: “Participants were a convenience sample of adults leaving the main university library on four weekday afternoons in [month, year]. Of [number] people approached, 400 completed the questionnaire.”
Limitations: “Because recruitment took place at the library, 88% of participants were students, against 20% of adults in the town [census source]. Students reported lower turnout than other residents (22% against 53%), so the unweighted figure of 26% understates turnout in the town. Weighting by student status gives 47%, but this assumes that the non-students we met vote like non-students in general, which we could not check. The results describe library users on weekday afternoons.”
The limitations paragraph gives the size of the imbalance, the direction of the bias and the assumption behind the correction. Whether results carry over to other people and settings is the external validity question, the one a convenience sample weakens most, and our guide to the limitations of a study has a template and more published examples.
Where Papero fits
Papero is an AI writing workspace for students and researchers. It does not choose or analyse your sample; that stays with you. It helps with the reading and writing around it.
Find papers searches more than 250 million papers through OpenAlex, so you can find published studies on your topic that used a convenience sample. Upload their PDFs to your library, and Chat answers only from your library and the document you have open, citing the passages it used, so you can ask how each paper recruited and how it worded its limitations. The glossary entry on random sampling covers the probability side, and the literature review page shows how one source library carries through a review.
Frequently Asked Questions
Is convenience sampling qualitative or quantitative?
Both use it. Quantitative surveys and clinical studies rely on it when random sampling from a full list of the population is impossible or too expensive. Qualitative studies use it for interviews and focus groups, although purposive sampling is more usual there. What changes is the claim each must limit: population estimates in quantitative work, transferability in qualitative work.
Why is a convenience sample biased?
The people who are easy to reach usually differ from those who are not. Students outside a library, patients at a university hospital and people who answer an online link share traits, such as age, education or interest in the topic, that can be related to the outcome. Because selection chances are unknown, the size of that bias cannot be calculated from the sample itself.
Can you generalise from a convenience sample?
Only to the group the sample was drawn from, and only if people within that group were not picked in a biased way. A convenience sample of first-year psychology students at one university speaks, at best, for first-year psychology students there. Extending it to all students or all adults needs outside evidence that the groups are alike on the variables that matter.
What is the difference between a convenience sample and a random sample?
In a random sample every member of the population has a known, nonzero chance of selection, usually by drawing from a complete list, so sampling error can be estimated. In a convenience sample people are included because they are available, their chances of selection are unknown, and the gap between sample and population cannot be estimated from the data.
Does a larger convenience sample reduce bias?
No. A larger convenience sample is more precise, not more accurate. In a simulated campus survey, samples of 100, 400 and 2,000 people all put voter turnout at about 23.5% when the true figure was 48%; the bigger samples only narrowed the confidence interval around the wrong number. Reducing bias needs better selection or a correction based on known population figures.
Sources
- Andrade, C. (2021). The inconvenient truth about convenience and purposive samples. Indian Journal of Psychological Medicine, 43(1), 86–88. https://doi.org/10.1177/0253717620977000
- Elfil, M., & Negida, A. (2017). Sampling methods in clinical research; an educational review. Emergency, 5(1), e52. https://pmc.ncbi.nlm.nih.gov/articles/PMC5325924/
- Etikan, I., Musa, S. A., & Alkassim, R. S. (2016). Comparison of convenience sampling and purposive sampling. American Journal of Theoretical and Applied Statistics, 5(1), 1–4. https://doi.org/10.11648/j.ajtas.20160501.11
- Loo, L. C., Ong, K. W., Ahmad Nidzwal, A. K., Razali, M. H., Ahmad, N., Naim, A., Daud, F., Abdul Gafor, A. H., & Ahmad, N. (2022). Knowledge of chronic kidney disease among undergraduate and postgraduate students in a public university in Klang Valley, Malaysia: A cross sectional study. PLOS ONE, 17(9), e0274038. https://doi.org/10.1371/journal.pone.0274038
- Prah, P., Hickson, F., Bonell, C., McDaid, L. M., Johnson, A. M., Wayal, S., Clifton, S., Sonnenberg, P., Nardone, A., Erens, B., Copas, A. J., Riddell, J., Weatherburn, P., & Mercer, C. H. (2016). Men who have sex with men in Great Britain: Comparing methods and estimates from probability and convenience sample surveys. Sexually Transmitted Infections, 92(6), 455–463. https://doi.org/10.1136/sextrans-2015-052389
- Thabane, L., Ma, J., Chu, R., Cheng, J., Ismaila, A., Rios, L. P., Robson, R., Thabane, M., Giangregorio, L., & Goldsmith, C. H. (2010). A tutorial on pilot studies: The what, why and how. BMC Medical Research Methodology, 10, Article 1. https://doi.org/10.1186/1471-2288-10-1
- Wild, H., Kyröläinen, A.-J., & Kuperman, V. (2022). How representative are student convenience samples? A study of literacy and numeracy skills in 32 countries. PLOS ONE, 17(7), e0271191. https://doi.org/10.1371/journal.pone.0271191