In this lesson you will
- Report findings without explaining them yet
- Choose a table or a chart for your data and give it a caption
- Refer to it in the sentence that states the result
A results section reports what you found, in the order of your questions, without saying yet what it means. Exact values go in a table; a trend or a comparison goes in a chart. Each one gets a numbered caption, and the text refers to it. In Papero you press Insert, choose Table, type the caption, then type / in your sentence and pick the table under Refer to.
Report first, explain later
The Results says what happened, with numbers. "After 28 days, exposed fish weighed less than control fish" is a result. "This suggests microplastics reduce feeding" is an interpretation, and it waits for the discussion.
Use a table when the reader needs exact values: mean length and weight per group, with the number of fish and the spread. Use a chart when the shape matters: growth in two groups over four weeks is easier to see as two lines than as a column of numbers. Do not show the same data twice.
Each table and chart needs a caption that says what it shows, and the text has to point to it: "Table 1 gives the mean weight per group." A reader should get the main result from your sentence alone and turn to the table for the detail.
Lines to copy
- Table title (APA puts it in Title Case)Mean Length and Weight of Juvenile Zebrafish After 28 Days, by Group
- Sentence that reports a tableAfter 28 days, fish in the exposure group weighed less on average than fish in the control group (M = ..., SD = ... against M = ..., SD = ...; t(58) = ..., p = ...), as shown in [the table you insert with Refer to].
- Chart captionMean weight of exposed and control fish, measured every seven days
In Papero
Set it up in Papero
Works on Free. Tables, captions, references to them and a chart made from a table use no AI. Describing a chart in words in the chart panel uses AI and counts toward your allowance.
- Put your cursor in the Results where the table belongs. On a wider screen, press Insert on the toolbar and choose Table, then click the size you want in the grid. On a phone, Table adds a three by three table. To bring in a CSV or Excel file, press Import from a file… there instead.
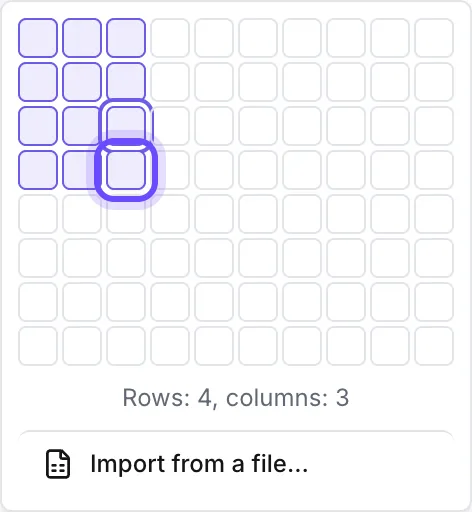
- The table comes with a numbered caption line above it. Type what the table shows.
- Fill in the cells. With your cursor in the table, Table tools adds rows and columns, and Add a note puts a note under it.
- To show the data as a chart instead, press Make a chart from this table in Table tools, press Insert in the chart panel, then delete the table. The chart is a numbered figure with its own caption.
- In the sentence that reports the result, type / and pick the table or figure under Refer to. The reference updates its number when you add or move tables and figures.
Practice
Your task
- Choose one result and decide whether a table or a chart shows it better.
- Insert it in the Results with a caption that says what it shows.
- Write two or three sentences that report the result without explaining it, and refer to the table or chart from Refer to.
You are done when your Results has one numbered table or chart with a caption, and a sentence that refers to it by its number.
Common mistakes
- Explaining in the Results"Because the fish ate less" is a reason, and reasons go in the discussion. Keep the Results to what you measured.
- Typing "Table 1" by handA typed number goes wrong as soon as you add a table above it. Insert the reference from Refer to and it renumbers itself.
- A caption that only names the variable"Weight" tells the reader little. Say what was measured, in whom, when and by which groups.
Key points
- The Results reports. The discussion explains.
- Exact values in a table, trends in a chart, never both for the same data.
- Caption every table and chart, and refer to each one in the text.
Up next · Lesson 11 of 20 · 7 min
Write the discussion, limitations and conclusion
A discussion that ties each finding to a cited paper
Mark as done and continueYou marked this lesson as done.